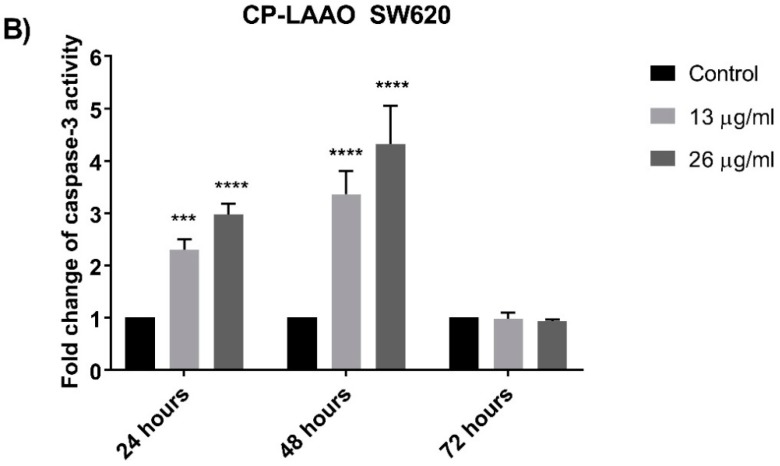
Figure 5.
Caspase-3 activity in CP-LAAO-treated SW480 (A) and SW620 (B) cells measured at 24, 48, and 72 h. Experiments were performed in duplicates and results compared between three independent experiments (n = 3). Results were analyzed using One Sample t-tests between the ratios of means of caspase-3 activity of treated samples over untreated samples. Asterisks indicate statistically significant data (*** p ≤ 0.001, **** p ≤ 0.0001). Error bars represent standard deviation (SD).


