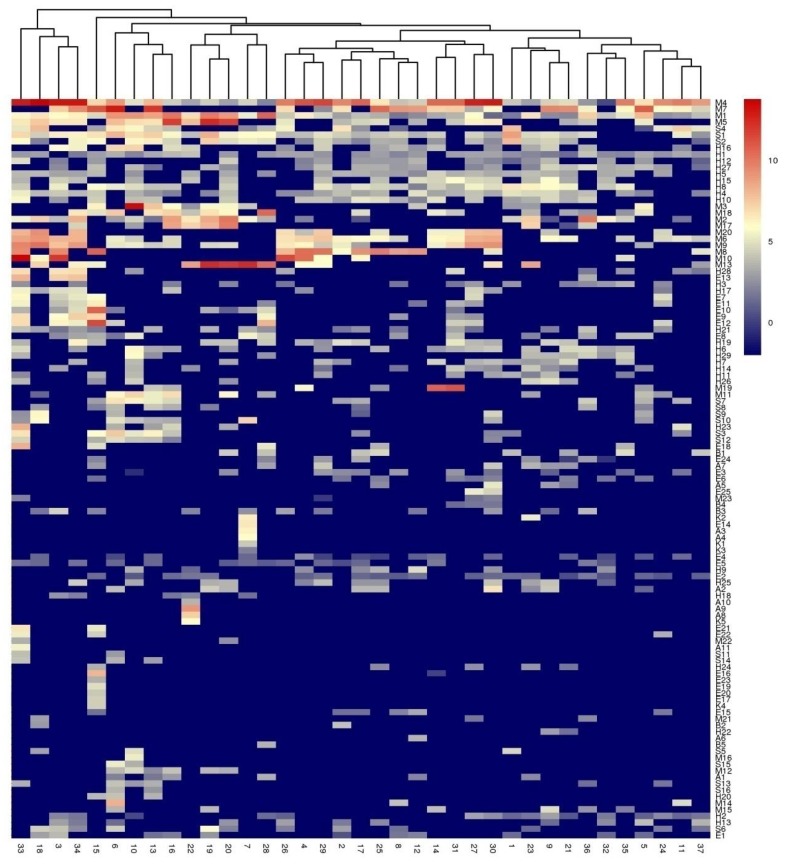
Figure 3.
Hierarchical clustering (HCA) and heatmap of volatile compounds levels in 37 mango cultivars. values of all studied volatile compounds per cultivar are shown in the heatmap on a blue (negative) to red (positive) scale. The HCA and dendrogram of cultivars was according to Euclidean distance.

