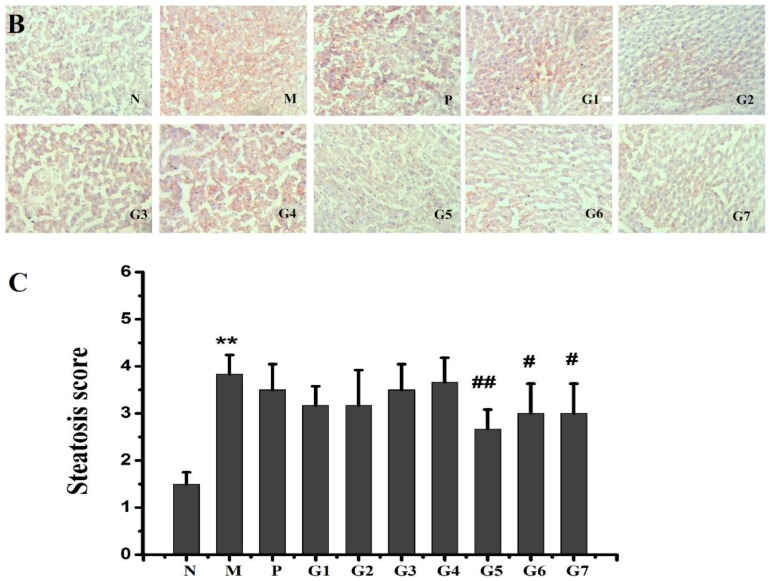
Figure 5.
Effect of GA on hepatic histology determined by H&E staining (A) and Oil red O staining (magnification 100×) (B); Steatosis score (C) was graded on a scale of 0 (<5%), 1 (5–33%), 2 (34–66%), and 3 (>66%). N: normal group, M: model group, P: silybin positive group, G1: 18α-GA:18β-GA = 10:0, G2: 18α-GA:18β-GA = 8:2, G3: 18α-GA:18β-GA = 6:4, G4: 18α-GA:18β-GA = 5:5, G5: 18α-GA:18β-GA = 4:6, G6: 18α-GA:18β-GA = 2:8, G7: 18α-GA:18β-GA = 0:10. The values were expressed as mean ± SD (n = 8). ** p < 0.01 vs. normal group, # p < 0.05, ## p < 0.01 vs. model group.


