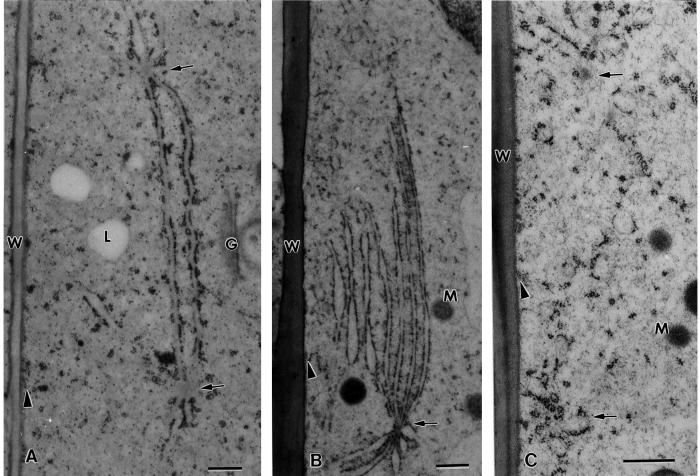
Figure 9.
Higher magnification views of nodal ER domains (arrows) of a control cell (A), a cell treated with 1 μm latrunculin A for 1 h (B), and a cell treated with 10 μm propyzamide for 1 h (C). Note the greatly expanded rough ER membrane sheets associated with the nodal ER domain in the latrunculin A sample and the loss of nodal ER domains in the propyzamide-treated specimen. W, Cell wall; G, Golgi; M, mitochondrion; L, lipid body; arrowheads, cortical microtubules. Compare with Figure 8. Bar = 0.5 μm.

