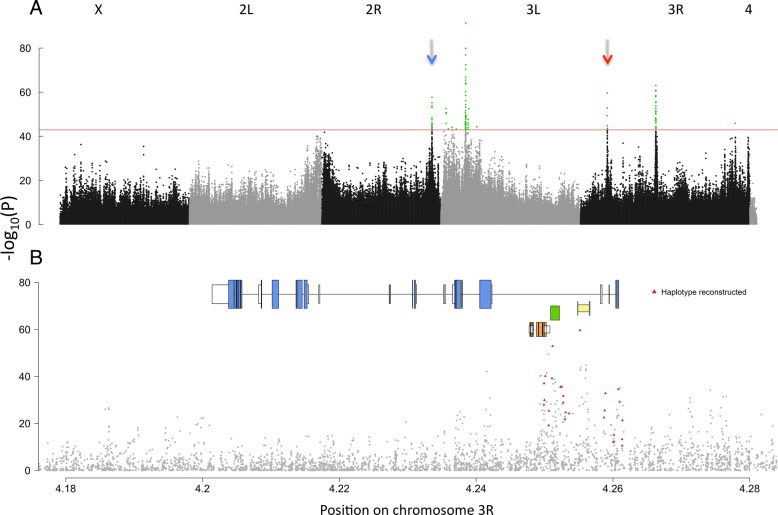
Fig. 3.
Genomic signature of adaptation to a hot laboratory environment. a Manhattan plot displaying the Cochran–Mantel–Haenszel p values of 2,741,793 SNPs (Methods). The red line indicates the p value cutoff for the most significant 100 SNPs (in green). The red and blue arrows indicate the SNF4Aγ and Sestrin peaks, respectively. b A close-up of Manhattan plot around the SNF4Aγ region. On top of the Manhattan plot the gene structure of SNF4Aγ is shown together with three small genes (Snmp1, CG5810, and cDIP; see Additional file 2: Table S3) located in one large intron of SNF4Aγ. Exons are indicated by colored boxes and introns by thin lines. White boxes indicate untranslated regions

