
Figure 3.
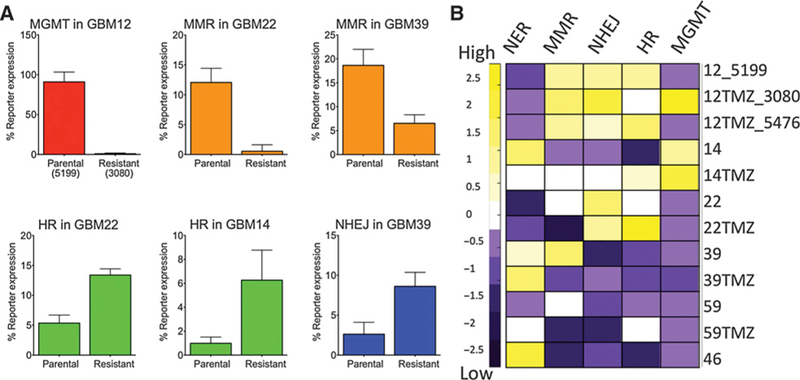
DNA repair capacity measured using FM-HCR in glioblastoma cells. A, Statistically significant changes in DRC in PDX models of acquired temozolomide resistance. Note that for the MGMT assay, lower percentage of reporter expression corresponds to higher MGMT activity. Error bars represent the standard deviation of at least three measurements. B, A heat map representing Z-scored DNA repair capacity in five pathways (columns) for all 12 glioblastoma models (rows; numbers refer to the parental GBM lines and the “TMZ” suffix refers to acquired temozolomide resistance lines labeled “Resistant” in panel A). Purple, cell lines with repair capacity below the mean; yellow, cell lines with repair capacity above the mean; white, cell lines with repair capacity at or near the mean.