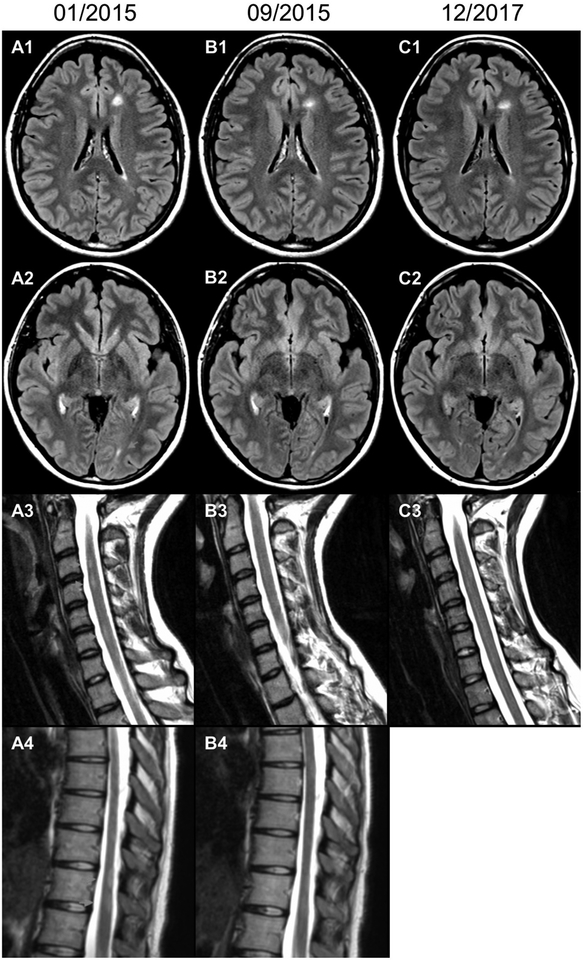
Figure.
Axial T2-FLAIR MRI images of the brain (A1–C1, A2–C2) immediately prior to, 8.5 months after, and 35 months after starting Combivir. Sagittal T2-weighted MRI images of the cervical (A3–C3) and thoracic cord (A4, B4) before and after starting Combivir. MRI of the thoracic cord at 35 months was not performed. All imaging was done without gadolinium contrast on 12/2017 due to lack of clinical symptoms.

