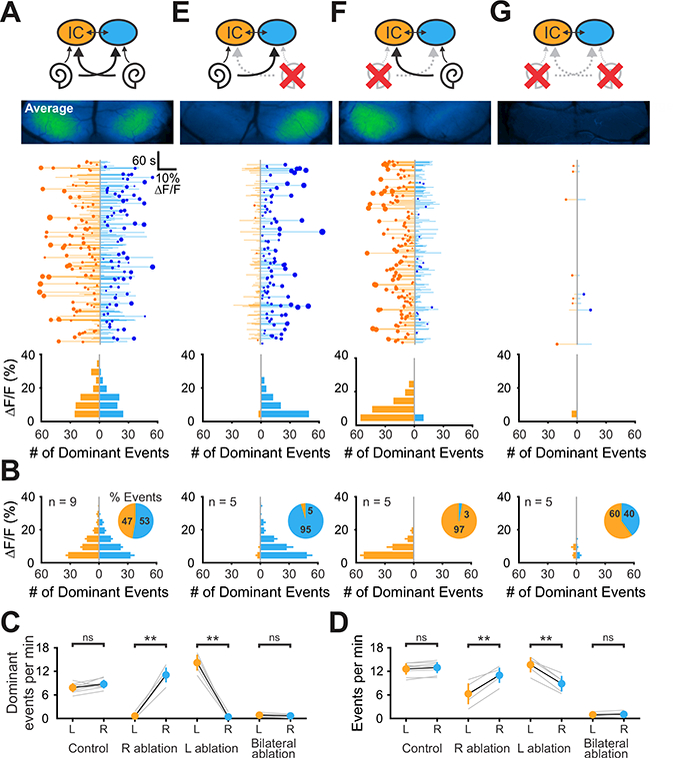
Figure 3. Spontaneous activity in the inferior colliculus originates in the cochlea.

(A) Top: Diagram illustrating flow of information through the auditory system and average intensity image over the 10-minute imaging session. Middle: Graph showing activity over time in left (orange) and right (blue) IC, where each line indicates the amplitude of the fluorescence change, the circle indicates the side which had the greatest intensity and the size of the circle indicates the difference in fluorescence. Bottom: Histogram showing the number of dominant events of different amplitudes.
(B) Average histogram of events across the group. Inset: pie graphs indicating the relative percentage of dominant events for each lobe.
(C) Graph of frequency of dominant activity in the left and right lobe of the IC across conditions. Gray lines indicate individual examples, black is the mean ± S.E.M. (n indicated in (B); two-tailed paired t-test, ns: not significant, **: P < 0.005).
(D) Graph of frequency of all activity in the left and right lobe of the IC across conditions. (n indicated in (B); two-tailed paired t-test, ns: not significant, **: P < 0.005).
(E - G) Similar to A, but for ablations of right, left, and both cochleae.
