
Figure 5. Spontaneous activity persists in mice lacking functional VGLUT3.
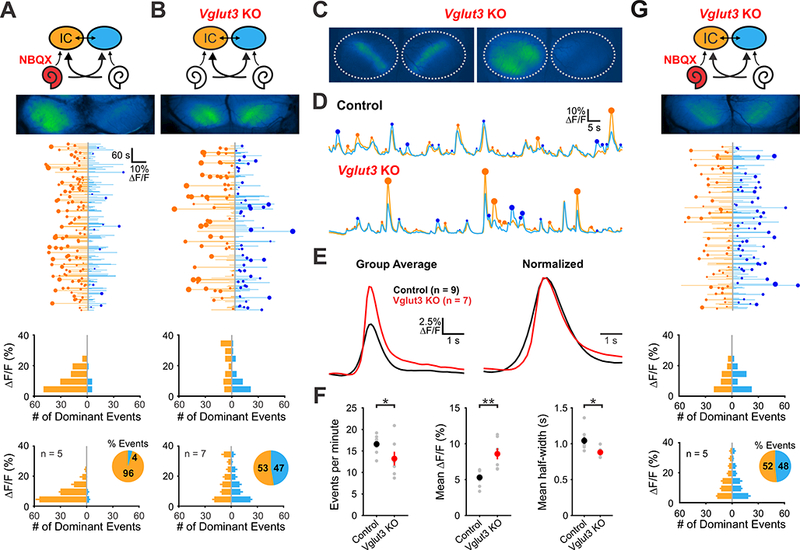
(A) Top: Diagram illustrating flow of information through the auditory system and average intensity image over the 10-minute imaging session. NBQX (50 mM) was applied to the left round window membrane. Middle: Activity over time in left and right IC in an individual where each line indicates the fluorescence intensity of each detected event, the circle indicates the dominant lobe, and the size of the circle indicated the difference in fluorescence. Bottom: Histograms showing the frequency of dominant events of a given amplitude for this experiment and for all experiments (n = 5 mice).
(B) Similar to A, but in Vglut3 KO mice.
(C) Spontaneous events observed in Vglut3 KO mice.
(D) Example fluorescence transients from control and Vglut3 KO mice.
(E) Average and amplitude normalized transients from control and Vglut3 KO mice.
(F) Comparisons of average frequency, amplitude, and half-width from control and Vglut3 KO mice. (n = 9 control (Snap25-T2A-GCaMP6s; Vglut3+/+) and n = 7 Vglut3 KO animals; twotailed paired Student’s t-test with Bonferroni correction, *: P < 0.05, **: P < 0.005).
(G) Similar to A, but in Vglut3 KO mice with NBQX applied to the left ear.