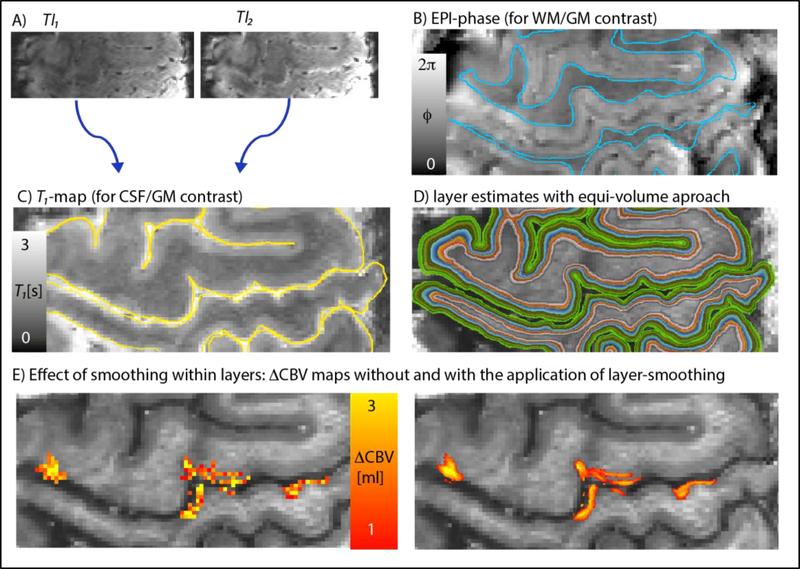
Fig. 2.
Layering of 9.4 T VASO data in EPI space. Images with different TIs (A) were divided to obtain T1-maps from the functional EPI data. EPI-phase (B) and T1-maps (C) were used for manual segmentation of GM. Panel D) depicts the corresponding estimates of cortical depths (a.k.a layers). Panel E) illustrates the effect of smoothing within layers. The expected double-layer-response is more clearly visible after smoothing. (two columns, 8’’ width)

