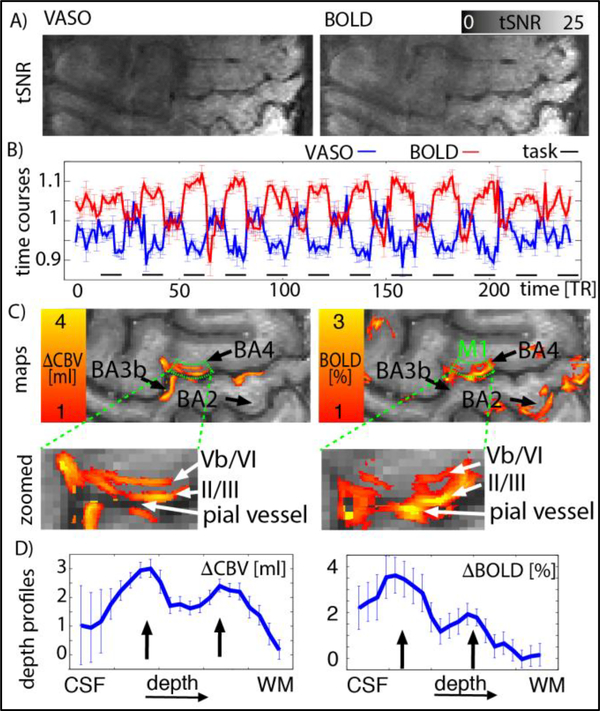
Fig. 3.
Measures of functional stability and sensitivity from one representative participant. Panel A) depicts tSNR for VASO and BOLD contrast. Panel B) depicts the time course of a GM ROI in M1 (BA4) (same for VASO and BOLD, green in panel C). It can be seen that the signal change between tapping and resting periods is larger than the noise between consecutive time points. Panel C) depicts layer-dependent activity maps for VASO and BOLD. It can be seen that GE-BOLD signal is dominated by activity from superficial layers. In VASO, however, a double stripe pattern can be seen in the index-finger region of M1. Panel D) presents the signal change as a function of cortical depth. The profile shows a double peak (black arrows). For BOLD, the double-peak feature is overlaid with a gradient of decreasing signal change towards deeper layers. (one-column, 4’’ width)

