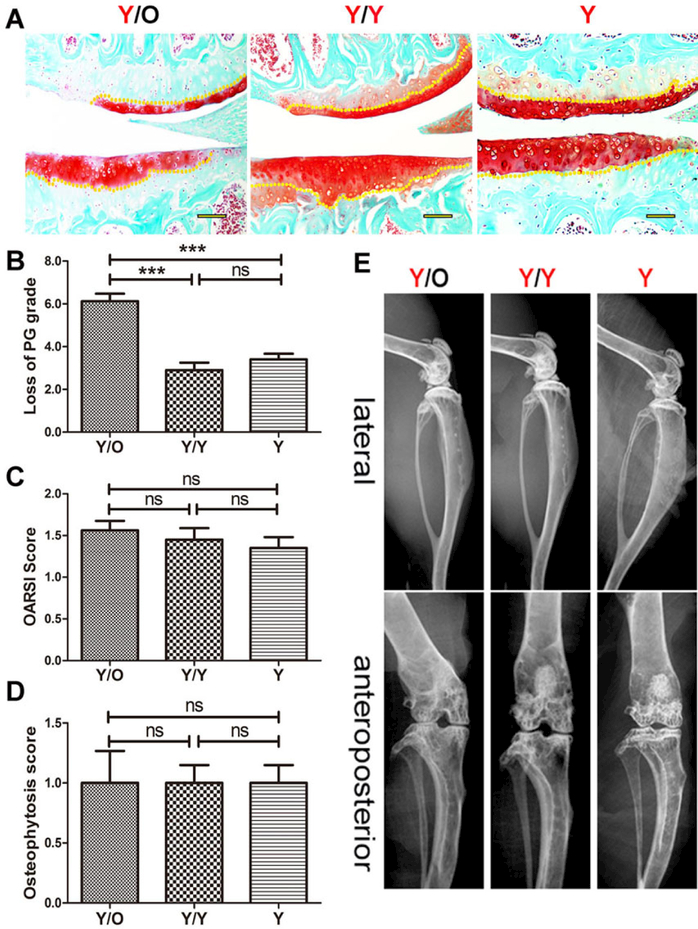
Figure 2:
Histological and radiographic changes in cartilage of young mice in the Y/O, Y/Y and Y groups. (A) PG decrease in young cartilage from the Y/O group was greater than that from the two other groups and histological scores in the Y/O group were relatively higher. Representative images are shown (8 Y/O mice, 10 Y/Y mice and 10 Y mice were used) Scale bar = 500 μm. (B) Loss of cartilage (proteoglycan grade) in young mice from the Y/O group was significantly greater compared to the Y/Y and Y groups. The area covered from the surface of the cartilage to the yellow dotted lines indicates the proteoglycan content. (C) There was no statistically significant difference in OARSI score among the three groups (p >0.05). (D, E) No significant pathological changes were detected in the micro-X-ray. The presence and severity of osteopenia and sclerosis among the three groups were not evident in this study, and osteophytosis was detected at the margins of the knee joint in young mice from the three groups. There was no statistically significant difference in osteophytosis scores among the three groups (p >0.05). The differences of the proteoglycan content, the Osteoarthritis Research Society International (OARSI) score and the osteophytosis scores among three groups were assessed by one-way ANOVA with Tukey’s post-hoc test.*** p <0.001. Values are presented as mean ± standard error of the mean. ns = not significant; O = old; Y = young

