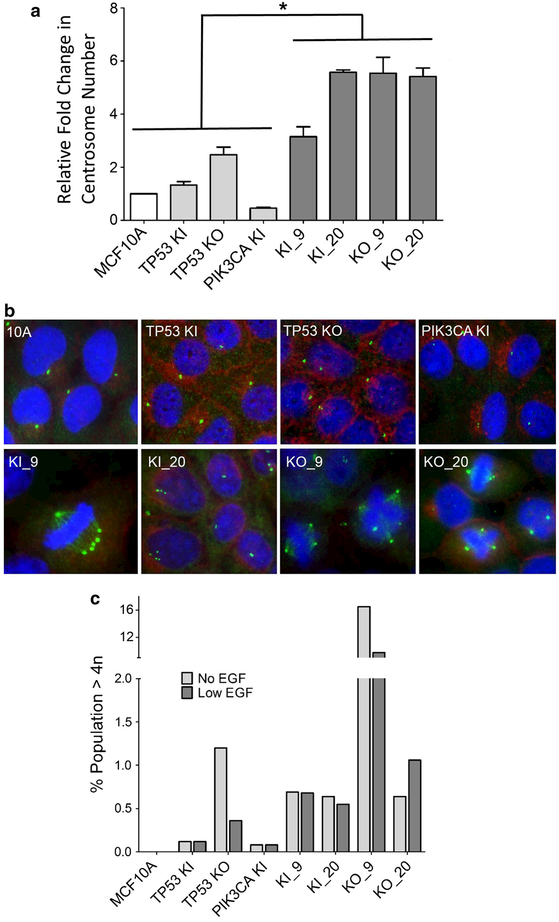
Fig. 3.
Double-mutant cell lines exhibit centrosome amplification.a Relative fold change of average centrosome number normalized to parental MCF10A. Double mutants showed statistically significant (*p < 0.05) amplification of centrosomes relative to controls and parental cell lines. b Centrosome amplification determined by immunofluorescence. Representative images for cells are shown. Green represents immunofluorescent staining of γ-tubulin for centrosome identification, while blue identifies nuclear labeling with DAPI. Centrosome counts of one and two are considered normal.c Double mutants show an increase in polyploidy. Cells with >4n were determined using propidium iodide labeling followed by flow cytometry. Results are shown in both the absence and presence of physiologic (0.2 ng/ml) levels of EGF. MCF10A = parental cells, TP53 KI = MCF10A with TP53 R248W knockin mutation, TP53 KO = MCF10A with TP53 knockout, PIK3CA KI = MCF10A with single PIK3CA E545K knockin, KI_9 = MCF10A with TP53 R248W knockin and PIK3CA E545K knockin, KI_20 = MCF10A with TP53 R248W knockin and PIK3CA H1047R knockin, KO_9 = MCF10A with TP53 knockout and PIK3CA E545K knockin, and KO_20 = MCF10A with TP53 knockout and PIK3CA H1047R knockin

