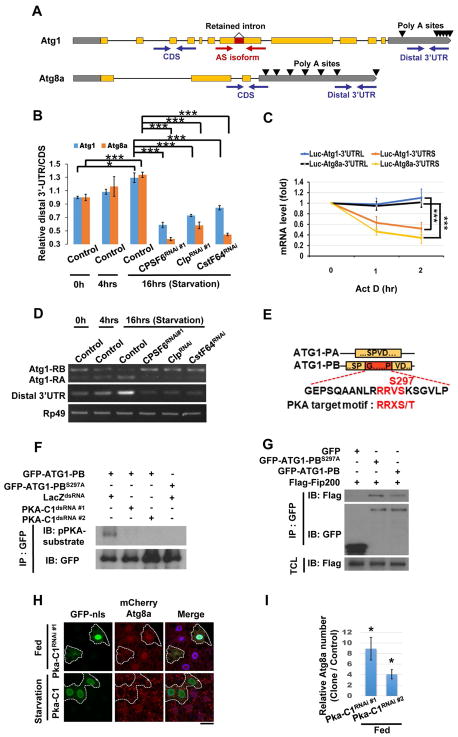
Figure 2. The CPA complex controls 3′UTR length and splicing of Atg1 and Atg8a.
(A) Primers detect the Atg1 AS isoforms (with or without the retained intron), the total (CDS), or the long-specific transcripts (Distal 3′UTR) of Atg1 and Atg8a. Poly A sites are indicated by arrows. (B) The ratio between amplicons (Distal 3′UTR/CDS) represents APA isoform changes under different conditions. Compared with control under fed conditions (starvation 0 hr), the 3′UTR length of Atg1 and Atg8a transcripts increased in control larval fat bodies, but not from CPSF6RNAi, ClpRNAi, or CstF64RNAi-expressing larva under starvation for 16 hrs. (One-Way ANOVA followed by Bonferroni’s post hoc test; data are represented as mean ± SEM; *P<0.05, **P<0.01, ***P<0.001.) (C) Long 3′UTRs of Atg1 and Atg8a enhanced mRNA stability. Firefly Luciferase reporters with the indicated 3′UTRs were transfected into S2R+ cells. After 48 hrs, cells were treated with Rapamycin (20 nM) for 24 hrs, followed by Actinomycin D (10 μg/ml) for the indicated times to measure mRNA levels of Firefly Luciferase by qPCR (One-Way ANOVA followed by Bonferroni’s post hoc test; data are represented as mean ± SEM; ***P<0.001). (D) The CPA complex mediates starvation-induced AS of Atg1. RNA extracted from larval fat bodies was subjected to RT-PCR to detect the two AS isoforms, RA and RB, and the long-UTR specific transcripts (Distal 3′UTR) of Atg1. (E–G) PKA phosphorylates ATG1-PB-S297 to promote ATG1 kinase complex assembly. Yellow boxes represent the shared amino acid sequences between ATG1-PA and ATG1-PB, and the red box indicates the peptide sequence from the retained intron of Atg1-RB. Alignment of amino acid sequences encoded by the retained intron of Atg1-RB showing the PKA phosphorylation motif (E). S2R+ cells were treated with dsRNA against LacZ or PKA-C1. After 48 hrs, cells were transfected with GFP-Atg1-RB or GFP-Atg1-RBS297A, and then subjected to immunoprecipitation (IP), followed by immunoblotting (IB) with antibodies as indicated (F). S2R+ cells transfected with plasmids as indicated were subjected to immunoprecipitation (IP). Immunoprecipitated proteins and total cell lysates (TCL) were analyzed by immunoblotting (IB) with antibodies as indicated (G). (H–I) Clonal expression of PKA-C1RNAi in GFP-nls-labeled cells increased mCherry-ATG8a puncta under fed conditions, but PKA-C1 expression failed to affect it upon starvation (H). Cells outside of the clones are used as controls. Fat body cells are stained with DAPI. Scale bar, 20 μm. (I) Quantification of the relative number of mCherry-ATG8a dots. (Student’s T-test was performed to identify significant differences between dot numbers in clones and in control cells; data are represented as mean ± SEM of 3 fat-body samples per genotype; *P<0.05).

