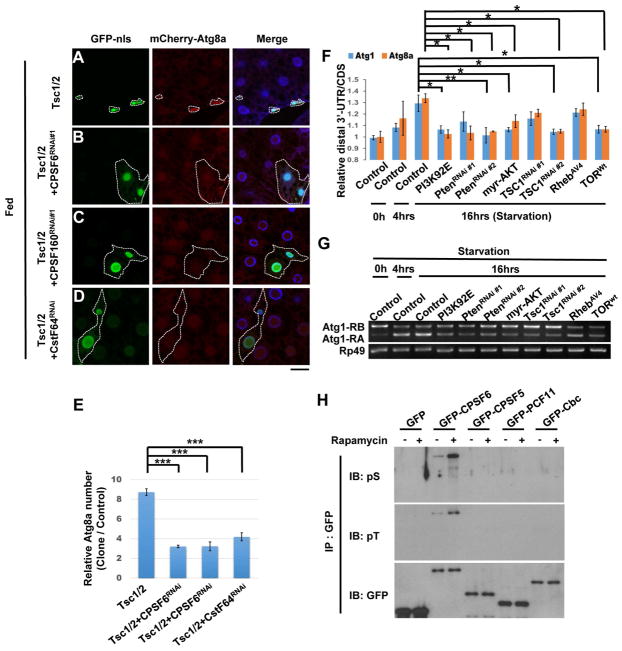
Figure 3. TORC1 signaling regulates the CPA complex by inhibiting CPSF6 phosphorylation.
(A–E) The CPA complex genetically interacts with TOR. Clonal expression of TSC1 and TSC2 reduced cell size and increased mCherry-ATG8a puncta in the larval fat body under fed conditions (A). These effects were suppressed by depletion of CPSF6 (B), CPSF160 (C), or CstF64 (D). Fat body cells were stained with DAPI. Scale bar, 20 μm. Quantification of the relative number of mCherry-ATG8a dots per cell (One-Way ANOVA followed by Bonferroni’s post hoc test; data are represented as mean ± SEM; ***P<0.001) (E). (F–G) PI3K/AKT/TORC1 signaling regulates APA and AS of Atg1 and Atg8a. RNA from larval fat body of indicated transgenes was subjected to qPCR or RT-PCR to detect APA and AS isoforms. One-Way ANOVA followed by Bonferroni’s post hoc test; data are represented as mean ± SEM; *P<0.05, **P<0.01. (H) Rapamycin enhances phosphorylation of CPSF6. S2R+ cells transfected with plasmids as indicated were treated with or without Rapamycin (20 nM) for 24 hrs and then subjected to immunoprecipitation (IP), followed by immunoblotting (IB).

