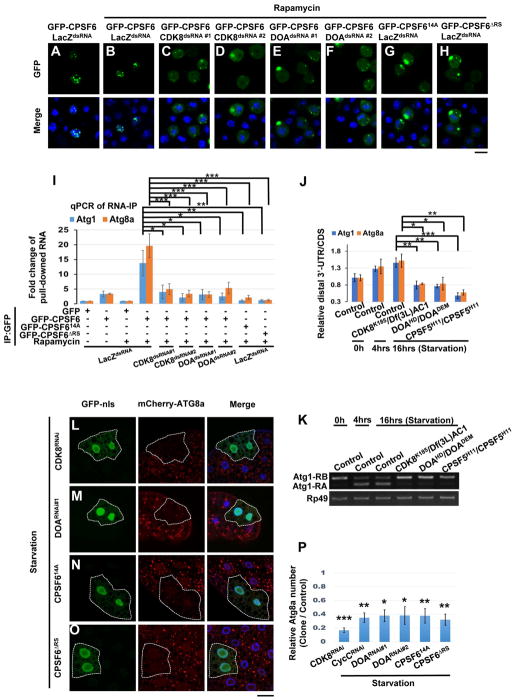
Figure 5. Phosphorylation of the RS domain of CPSF6 is required for its nuclear localization, binding to RNA, and autophagy.
(A–H) Phosphorylation of the RS domain of CPSF6 is required for its nuclear localization. S2R+ Cells were treated as in Fig S4C and then subjected to immunofluorescence. GFP-CPSF6 was localized in the nuclei of control cells (LacZdsRNA) with or without Rapamycin (20 nM) (A–B), whereas it redistributed to the cytoplasm in cells treated with dsRNAs against CDK8 or DOA (C–F). GFP-CPSF614A and GFP-CPSF6ΔRS were localized in the cytoplasm (G–H). S2R+ cells are stained with DAPI (blue). Bar, 10 mm. (I) Phosphorylation of the RS domain of CPSF6 is critical for RNA binding. Cells as in Fig S4C were subjected to RNA-immunoprecipitations, followed by qRT-PCR with primers (Figure 2A) which detect total transcript (CDS) of Atg1 or Atg8a. Plotted fold change values (ratios of RNA IP/input normalized to GFP control) are the mean ± SEM of triplicates. One-Way ANOVA followed by Bonferroni’s post hoc test; data are represented as mean ± SEM; *P<0.05, **P<0.01, ***P<0.001. (J–K) CDK8 and DOA affected APA and AS of Atg1 and Atg8a transcripts. RNA extracts from larval fat body in control or mutants as indicated were subjected to qPCR (J) or RT-PCR (K) analysis to detect the APA and AS isoforms of Atg1 and Atg8a. One-Way ANOVA followed by Bonferroni’s post hoc test. Data are represented as mean ± SEM; *P<0.05, **P<0.01, ***P<0.001. (L–P) CDK8 and DOA-mediated CPSF6 phosphorylation is required for autophagosome formation. Clonal expression of indicated transgenes (L–O) in GFP-nls-labeled cells reduced mCherry-ATG8a puncta upon starvation. Cells outside the clones are used as controls. Fat body cells were stained with DAPI. Scale bar, 20 μm. (P) Quantification of the relative number of mCherry-ATG8a dots per cell. (Student’s T-test was performed to identify significant differences between dot numbers in clones and in control cells; data represent as the mean± SEM of 3 fat-body samples imaged per genotype; *P<0.05, **P<0.01, ***P<0.001).

