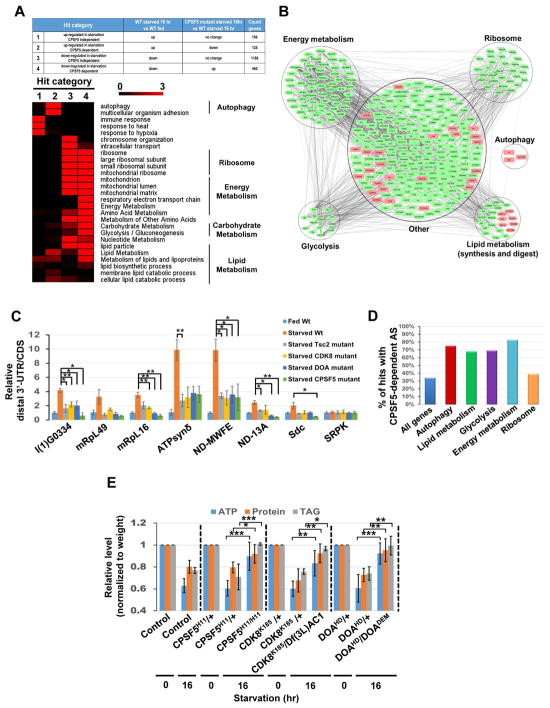
Figure 6. The CDK8/DOA/CPA complex controls lipid, protein and energy metabolism.
(A–B) RNA-seq analysis of transcriptome changes in the fat body of fed larvae, 16 hr-starved larvae, and 16 hr-starved CPSF5 mutant larvae. Heatmap displaying the -log10 (p-value) for each GO term. Color represents strength of significance (A). Network presentation of Gene Set Enrichment Analysis results. Genes are shown as nodes. Green node color indicates genes that are downregulated in starvation and that are CPSF5-dependent. Pink node color represents genes that are upregulated in starvation and CPSF5-dependent (B). (C) 3′-UTR changes of transcripts involved in metabolism. RNA samples as in Fig S5G were subjected to qPCR to detect CDS and the long-UTR specific transcripts (distal 3′UTR) of genes involved in metabolism. The relative distal 3′UTR/CDS results for the other six genes mentioned in Fig S5G could not be measured due to qPCR primers design issues. One-Way ANOVA followed by Bonferroni’s post hoc test. Measurements shown are mean ± SEM; *P<0.05, **P<0.01. (D) Illustration of the percentage of genes in various functional groups undergoing CPSF5-dependent alternative splicing among those responding to starvation. (E) CDK8, DOA, and CPSF5 are critical for starvation-induced metabolomic changes. ATP, proteins, and triglyceride (TAG) levels were measured using whole control or mutant larvae as indicated and normalized to their weights. One-Way ANOVA test was performed followed by Bonferroni’s post hoc test. Measurements shown are mean ± SEM; *P<0.05, **P<0.01, ***P<0.001.

