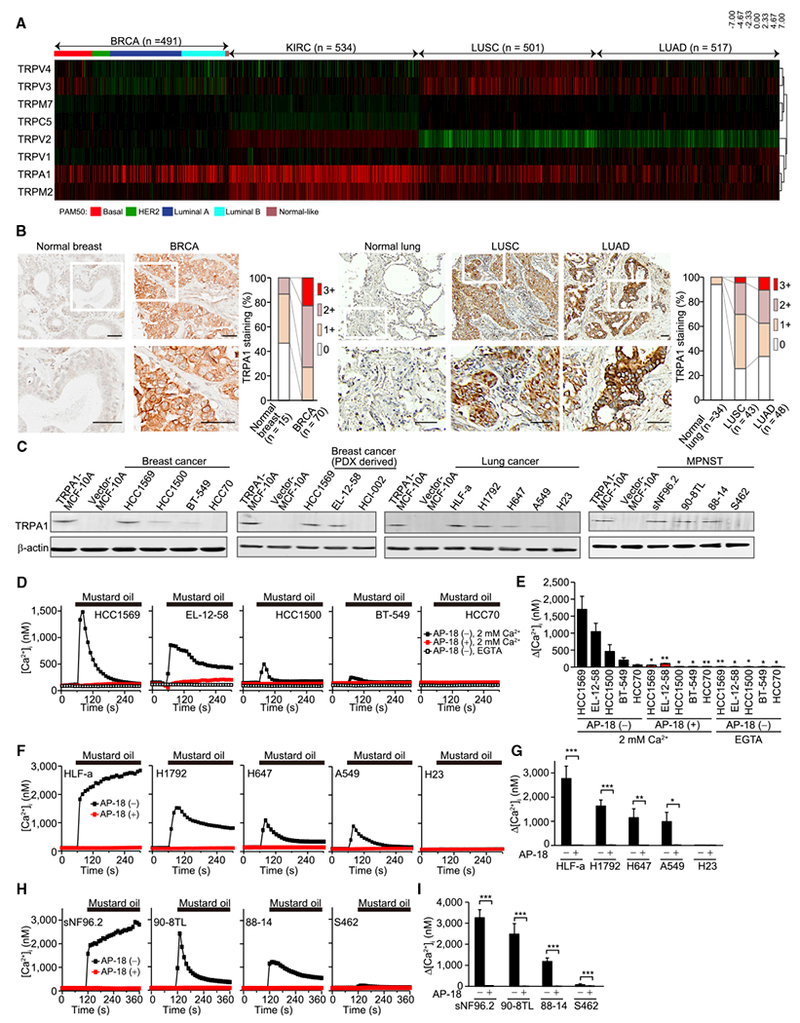
Figure 1. TRPA1 Is Functionally Overexpressed in Diverse Tumor Types.

(A) Heatmap of redox-sensitive TRP channel mRNA levels in TCGA BRCA, KIRC, LUSC, and LUAD relative to corresponding normal tissues (n = 121 for BRCA, n = 72 for KIRC, n = 51 for LUSC, and n = 59 for LUAD). The samples, whose PAM50 has not been identified, are not included for BRCA.
(B) Representative images of TRPA1 IHC in normal breast tissue and breast tumor sections and in normal lung tissue and lung tumor sections, and the score of staining level. An enlarged view of the boxed region in the top images is shown in the corresponding lower image. Scale bar, 50 μm.
(C) Immunoblot analysis of TRPA1 in the indicated breast cancer and lung cancer or MPNST cells.
(D and E) Averaged time courses of [Ca2+]i changes (D) and the maximal [Ca2+]i rises (Δ[Ca2+]i) (E) evoked by 30 μM mustard oil in Ca2+-free, 0.5 mM EGTA- or 2 mM Ca2+-containing solution are shown for the indicated breast cancer cells treated with or without 10 μM AP-18. Data are shown as means ± SEM (n = 13–117). *p < 0.05 and **p < 0.01 compared with AP-18 (–) in 2 mM Ca2+-containing solution (Student’s t test).
(F–I) Averaged time courses of [Ca2+]i changes (F and H) and Δ[Ca2+]i (G and I) evoked by 30 μM mustard oil in 2 mM Ca2+-containing solution in the indicated lung cancer (F and G) and MPNST cells (H and I) treated with or without 10 μM AP-18. Data are shown as means ± SEM (n = 21–60 for F and G, n = 12–100 for H and I). *p < 0.05, **p < 0.01, and ***p < 0.001 (Student’s t test).
See also Figure S1 and Tables S1 and S2.
