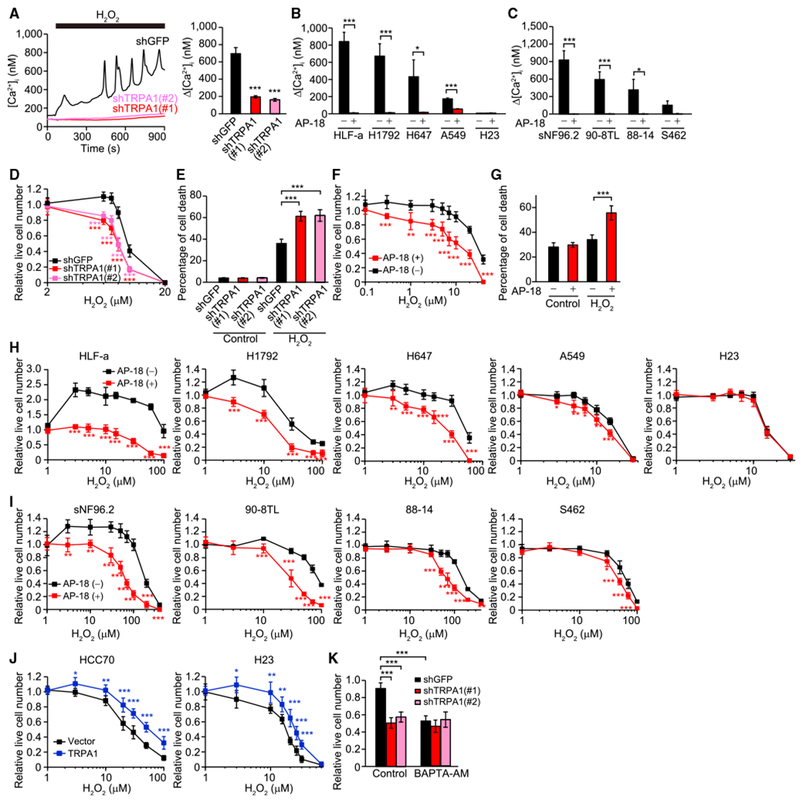
Figure 2. TRPA1 Increases [Ca2+]i and Cell Survival in Response to H2O2 in Cancer Cells.

(A) Representative time courses and Δ[Ca2+]i evoked by 10 μM H2O2 in the indicated HCC1569 cells. Data are shown as means ± SEM (n = 35–58). ***p < 0.001 compared with shGFP (Student’s t test).
(B and C) Δ[Ca2+]i evoked by 10 μM H2O2(B) or 30 μM H2O2 (C) in the indicated lung cancer (B) and MPNST cells (C) treated with or without 10 μM AP-18. Data are shown as means ± SEM (n = 21–120 for B, n = 28–107 for C). *p < 0.05 and ***p < 0.001 (Student’s t test).
(D) Live cell numbers relative to H2O2-untreated cells in the indicated HCC1569 cells upon treatment with H2O2 for 96 hr. ***p < 0.001 compared with shGFP (Student’s t test).
(E) Percentage of cell death in the indicated HCC1569 cells treated with or without 10 μM H2O2 for 96 hr. ***p < 0.001 (Student’s t test).
(F) Live cell numbers relative to H2O2-untreated cells in EL-12-58 cells treated with H2O2 for 72 hr in the presence or absence of 10 μM AP-18. **p < 0.01 and ***p < 0.001 compared with vehicle control for AP-18 (AP-18 [–]) (Student’s t test).
(G) Percentage of cell death in EL-12-58 cells treated with or without 20 μM H2O2 for 72 hr in the presence or absence of 10 μM AP-18. ***p < 0.001 (Student’s t test).
(H–J) Live cell numbers relative to H2O2-untreated cells in the indicated cancer cells upon treatment with H2O2 for 72 hr. In (H and I), cells were treated with or without 10 μM AP-18. In (J), cells were transduced with an empty lentiviral vector or TRPA1. *p < 0.05, **p < 0.01, and ***p < 0.001 compared with vehicle control for AP-18 (AP-18 [–]) in (H) and (I) and vector in (J) (Student’s t test).
(K) Live cell numbers relative to H2O2-untreated cells in the indicated HCC1569 cells treated with 8 μM H2O2 in the presence or absence of 10 μM BAPTA-AM for 96 hr. ***p < 0.001 (one-way ANOVA).
In (D–K), data are shown as means ± SD from the sum of three independent experiments performed in duplicate. See also Figure S2.
