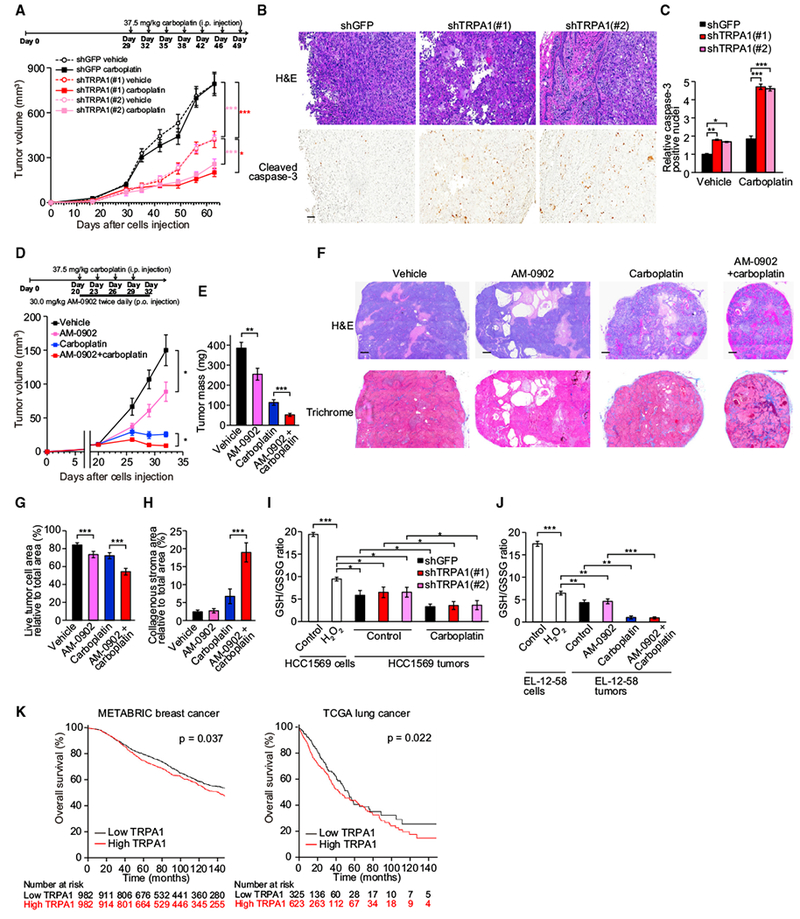
Figure 5. TRPA1 Inhibition Suppresses Tumor Growth and Enhances Chemosensitivity in Xenograft Models.

(A) shGFP- or shTRPA1-transduced HCC1569 cells were injected into cleared mammary fat pads of NOD-Rag1null Il2rgnull (NRG) mice and tumor growth was monitored over time (n = 7–9). Carboplatin was administrated as indicated. *p < 0.05 and ***p < 0.001 (two-way ANOVA).
(B) Representative field from H&E- and cleaved caspase-3-stained slides of tumors treated with carboplatin. Scale bar, 100 μm.
(C) Quantification of cleaved caspase-3-positive nuclei. Data normalized to shGFP-expressing tumors treated with vehicle and shown as mean ± SEM (n = 3–9). *p < 0.05, **p < 0.01, and ***p < 0.001 (one-way ANOVA).
(D) EL-12-58 cells were injected into cleared mammary fat pads of NRG mice and tumor growth was monitored over time (n = 10 for each arm). Drugs were administered as indicated. *p < 0.05 (two-way ANOVA).
(E) Tumor mass. **p < 0.01 and ***p < 0.001 (Student’s t test).
(F) Representative field from H&E- or trichrome-stained slides of the indicated EL-12-58 tumors. Scale bar, 500 μm.
(G and H) Quantification of live tumor cell area (G) or collagenous stroma area relative to total area (H) in the indicated EL-12-58 tumors. Data are shown as means ± SD (n = 5 for each arm). ***p < 0.001 (Student’s t test).
(I and J) GSH/GSSG ratio in the indicated HCC1569 cells or tumors (I) and the indicated EL-12-58 cells or tumors (J). Cells were cultured in monolayer in the presence or absence of 10 μM H2O2 for 24 hr. Data are shown as means ± SD of three independent experiments. *p < 0.05, **p < 0.01, and ***p < 0.001 (one-way ANOVA).
(K) Kaplan-Meier survival curves for overall survival of METABRIC breast or TCGA lung (LUSC and LUAD) cancers with low (below median) or high TRPA1 (above/including median). In TCGA lung cancers, TRPA1 expression was based on FKPM values.
In (B), (C), and (E–J), tumors were resected from mice in (A) or (D) at the endpoint. In (A), (D), and (E), data are shown as means ± SEM. See also Figure S5.
