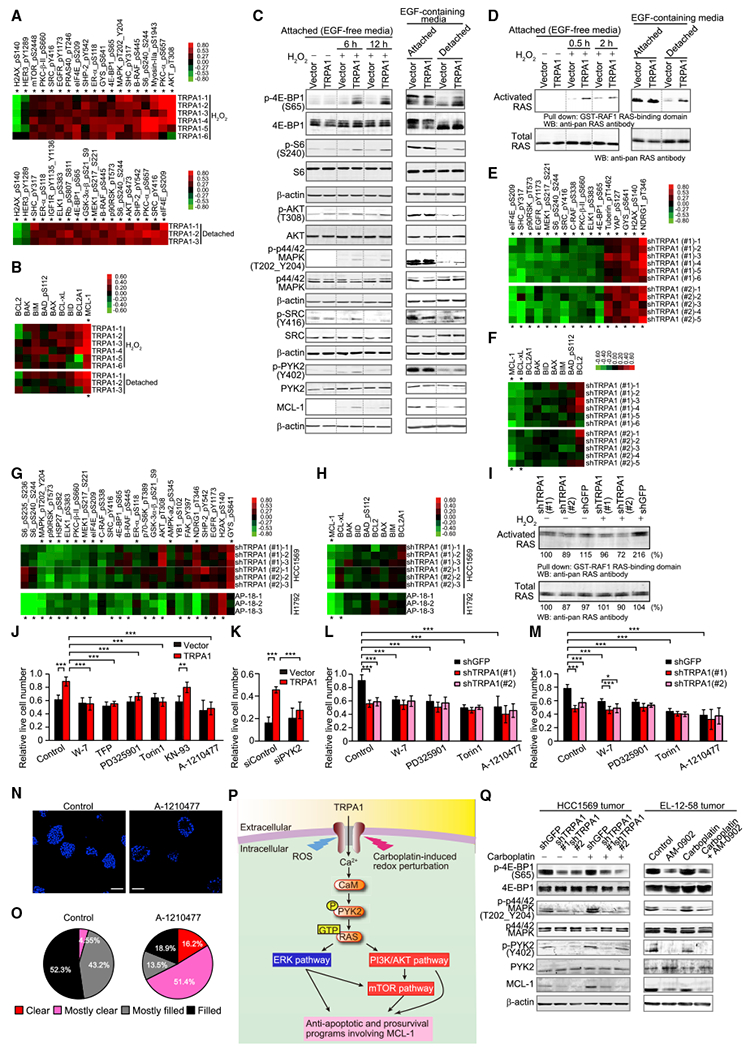
Figure 6. TRPA1 Mediates Oxidative-Stress Defense through Upregulation of Ca2+-Dependent Anti-Apoptotic Signaling Pathways.

(A) Heatmap of significantly changed phosphorylated proteins (*p < 0.05) between TRPA1- and vector-transduced MCF-10A cells in response to H2O2 or matrix deprivation (detached). Lysates of cells treated with 100 μM H2O2 for 24 hr or cultured in suspension for 24 hr were analyzed by RPPA and all signals from all samples were normalized to vector control.
(B) Heatmap of BCL-2 family proteins in TRPA1-transduced MCF-10A cells treated as in (A). *p < 0.05 comparing TRPA1 and vector.
(C) Immunoblot of lysates from the indicated MCF-10A cells treated with 100 μM H2O2 for 6 hr or 12 hr or cultured in suspension for 24 hr. Dotted lines indicate the cropping lines, and uncropped blots shown in Figure S5E.
(D) Ras activity in the indicated MCF-10A cells treated with 100 μM H2O2 for 0.5 hr or 2 hr or cultured in suspension for 24 hr, as determined by Ras-GTP pull-down assay. Uncropped blots shown in Figure S5F.
(E) Heatmap of significantly changed phosphorylated proteins (*p < 0.05) between shTRPA1 (#1 and #2)- and shGFP-transduced HCC1569 cells. Cells were treated with 10 μM H2O2 for 24 hr. Samples normalized to shGFP.
(F) Heatmap of BCL-2 family proteins in shTRPA1-transduced HCC1569 cells treated as in (E).
(G) Heatmap of significantly changed phosphorylated proteins (*p < 0.05), either between shTRPA1 (#1 and #2)- and shGFP-transduced HCC1569 cells or between AP-18- and its vehicle-treated H1792 cells. Cells were treated with 10 μM carboplatin in the presence or absence of 10 μM AP-18 for 24 hr. Samples normalized to shGFP for HCC1569 cells and AP-18 (–) for H1792 cells.
(H) Heatmap of BCL-2 family proteins in HCC1569 and H1792 cells treated as in (G).
(I) Ras activity in the indicated HCC1569 cells treated with 10 μM H2O2 for 2 hr. Normalized densitometric values are shown below each band.
(J and K) Live cell numbers relative to H2O2-untreated cells in the indicated MCF-10A cells treated with 70 μM H2O2 (J) or 100 μM H2O2 (K) in the presence or absence of 1 μM W-7, 10 μM TFP, 1 nM PD325901, 100 nM Torin1, 10 μM KN-93, or 3 μM A-1210477 for 72 hr. **p < 0.01 and ***p < 0.001 (one-way ANOVA).
(L and M) Live cell numbers relative to H2O2-untreated (L) or carboplatin-untreated cells (M) in the indicated HCC1569 cells treated with 8 μM H2O2 (L) or 10 μM carboplatin (M) in the presence or absence of 1 μM W-7, 10 nM PD325901, 100 nM Torin1, or 3 μM A-1210477 for 96 hr (L) or 72 hr (M). Data for control in (M) are from Figure 4L, as these samples were analyzed concurrently. *p < 0.05 and ***p < 0.001 (one-way ANOVA).
(N) Representative images of day-13 HCC1569 (shGFP) spheroids treated with or without 3 μM A-1210477. Spheroids were stained with DAPI. Scale bar, 100 μm.
(O) Pie chart of clearance levels of Day-13 HCC1569 (shGFP) spheroids treated with or without 3 μM A-1210477 (n = 44 for control and n = 37 for A-1210477: sum of two independent experiments).
(P) Model of the relevant TRPA1-regulated signaling pathways that contribute to oxidative-stress defense in cancer cells.
(Q) Immunoblot of lysates from the indicated HCC1569 or EL-12-58 tumors that were resected from mice in Figure 5A for HCC1569 tumors or Figure 5D for EL-12-58 tumors at the end point.
In (J–M), data are shown as means ± SD from the sum of three independent experiments performed in duplicate. See also Figures S6 and S7.
