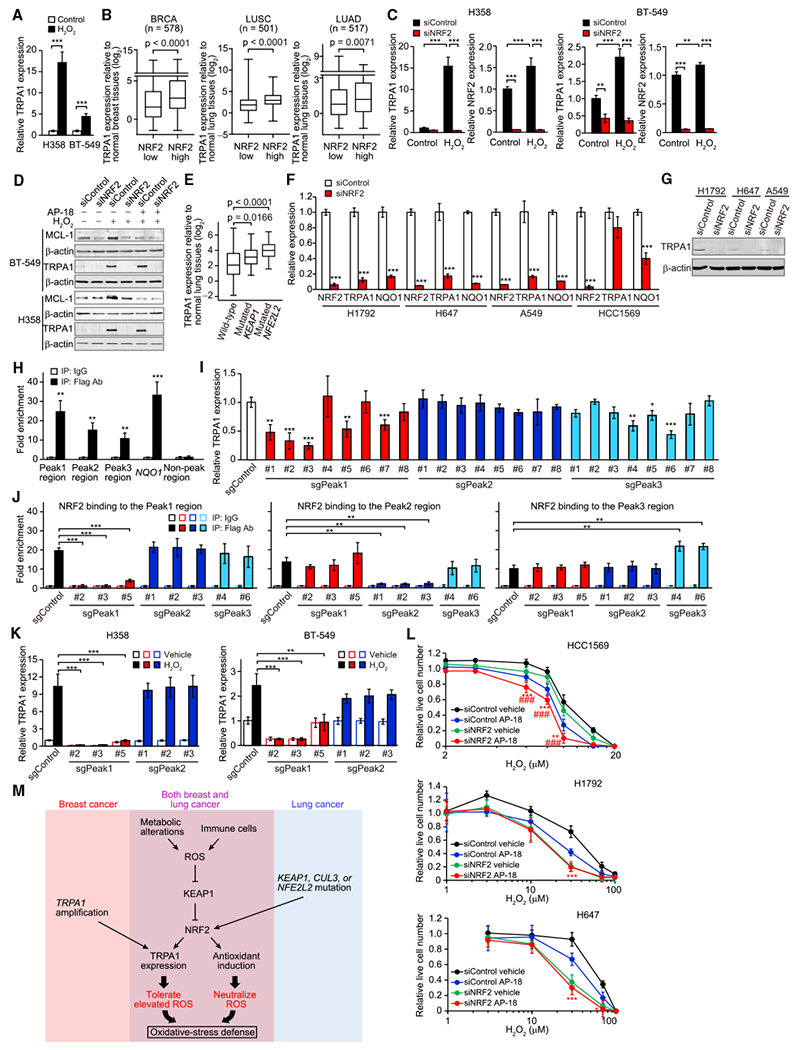
Figure 7. TRPA1 Expression Is Induced by NRF2.

(A) mRNA expression of TRPA1 in H358 or BT-549 cells treated with or without 10 μM H2O2 for 48 hr in serum-starved conditions (0.1% fetal bovine serum). Data were normalized to vehicle control. ***p < 0.001 (Student’s t test).
(B) Boxplots displaying TRPA1 mRNA levels relative to corresponding normal tissues in low or high NRF2 tumors from TCGA BRCA, LUSC, or LUAD. Statistical significance determined by the Student’s t test.
(C) mRNA expression of TRPA1 in the indicated H358 or BT-549 cells upon treatment with or without 10 μM H2O2 for 48 hr in serum-starved conditions. Data were normalized to small interfering RNA control (siControl) cells treated with vehicle control. **p < 0.01 and ***p < 0.001 (one-way ANOVA).
(D) Immunoblot of lysates from the indicated BT-549 or H358 cells treated with or without 10 μM H2O2 in the presence or absence of 10 μM AP-18 for 48 hr in serum-starved conditions.
(E) Boxplots displaying TRPA1 mRNA levels relative to normal lung tissues in wild-type (n = 114) and KEAP1- (n = 22) or NFE2L2-mutated (n = 26) LUSC based on TCGA dataset. Statistical significance determined by the Student’s t test.
(F) mRNA expression of NRF2, TRPA1, and NQO1 in the indicated cancer cells. Data were normalized to siControl. ***p < 0.001 compared with siControl (Student’s t test).
(G) Immunoblot analysis of TRPA1 in the indicated cancer cells.
(H) ChIP with Flag antibody of the fragmented chromatin containing the Peak1, Peak2, Peak3, or non-Peak region (Chr8: 72086158–72086422 [GRCh38]) or the NQO1 promoter (Chr16: 69727000–69727111 [GRCh38]) in Flag-NRF2-overexpressing H1792 cells. Binding was normalized to that in immunoprecipitation with immunoglobulin (Ig)G control. **p < 0.01 and ***p < 0.001 compared with IgG (Student’s t test).
(I) mRNA expression of TRPA1 in the indicated H1792 cells. Data were normalized to single guide RNA control (sgControl). *p < 0.05, **p < 0.01, and ***p < 0.001 compared with sgControl (Student’s t test).
(J) ChIP with Flag antibody of the fragmented chromatin containing the Peak1, Peak2, or Peak3 region in the indicated Flag-NRF2-overexpressing H1792 cells. Binding was normalized to that in immunoprecipitation with IgG control. **p < 0.01 and ***p < 0.001 (Student’s t test).
(K) mRNA expression of TRPA1 in the indicated H358 or BT-549 cells upon treatment with or without 10 μM H2O2 for 48 hr in serum-starved conditions. Data were normalized to sgControl cells treated with vehicle control. **p < 0.01 and ***p < 0.001 (Student’s t test).
(L) Live cell numbers relative to H2O2-untreated cells in the indicated cancer cells upon treatment with H2O2 for 72 hr in the presence or absence of 10 μM AP-18. Data are shown as means ± SD from the sum of three independent experiments performed in duplicate. *p < 0.05, **p < 0.01, and ***p < 0.001 compared with siControl cells treated with AP-18 (Student’s t test). ###p < 0.001 compared with siNRF2 cells treated with vehicle.
(M) Model of the induction of TRPA1 in breast and lung cancer.
In (A), (C), (F), and (H–K), data are shown as means ± SD of three independent experiments. In (B) and (E), box and whiskers graphs indicate the median and the 25th and 75th percentiles, with minimum and maximum values at the extremes of the whiskers. See also Figure S8 and Table S3.
