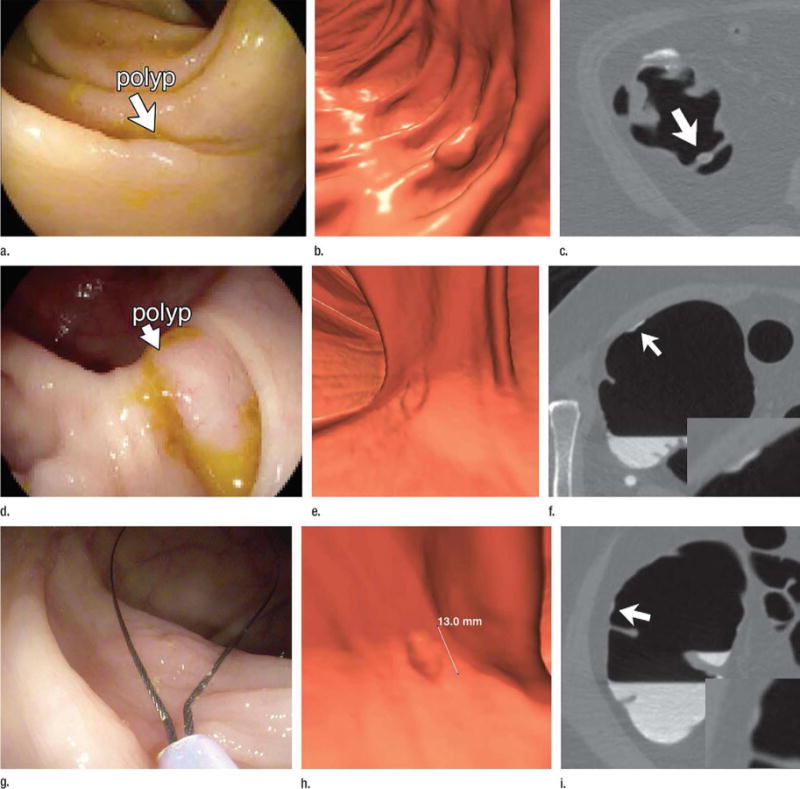
Figure 4. Interval progression of small colorectal polyps in two patients undergoing CTC surveillance.

3D colon map from CTC (A) showing the location of a small sigmoid polyp (arrow, red dot), which measured 7.8 mm at the index screening examination (B). Polyp segmentation for volume measurement is shown on both 3D and 2D (inset) views of B. At follow-up CTC 1 year later (C), the polyp grew only 0.8 mm in linear size but showed a 50% increase in volume (to 205 mm3). The lesion proved to be a tubulovillous adenoma after polypectomy at same-day colonoscopy (inset).
3D colon map (D) in a second patient showing the location of three small polyps in the right colon (arrows, red dots). 3D images from the index CTC (E) and surveillance CT colonography 16 months later (F) show a small sessile polyp in the proximal transverse colon that increased from 6.0 mm to 8.0 mm, but increased in volume by 203% (153% per year). Similar growth was seen with the two cecal polyps (not shown). The polyp in the transverse colon was a tubular adenoma, whereas the cecal lesions were both tubulovillous adenomas.
From Pickhardt PJ, Kim DH, Pooler BD, et al. Assessment of volumetric growth rates of small colorectal polyps with CT colonography: a longitudinal study of natural history. Lancet Oncol 2013;14:711-20; with permission.
