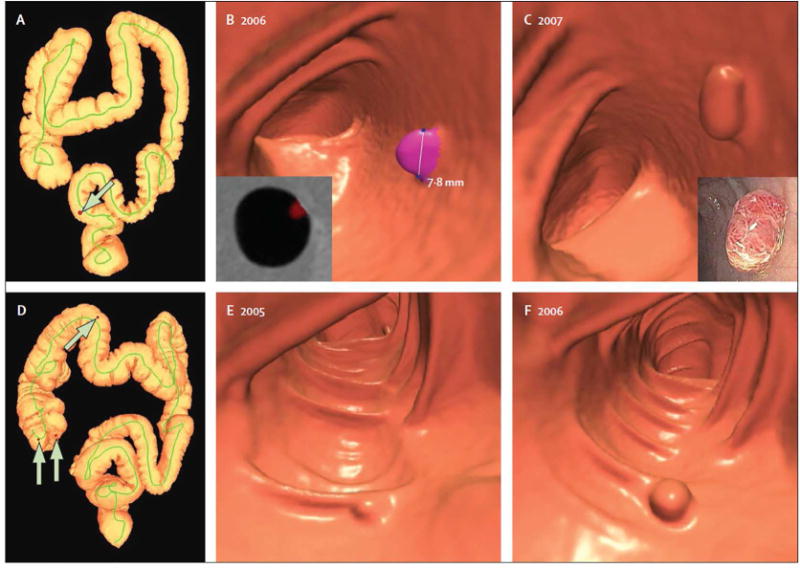
Figure 6. Polyp growth according to histological subgroup.

Polyp growth categories are shown according to the definition 20% volume change per year as progression or regression. Note overall mean growth in adenomas, especially those that are advanced.
From Pickhardt PJ, Kim DH, Pooler BD, et al. Assessment of volumetric growth rates of small colorectal polyps with CT colonography: a longitudinal study of natural history. Lancet Oncol 2013;14:711-20; with permission.
