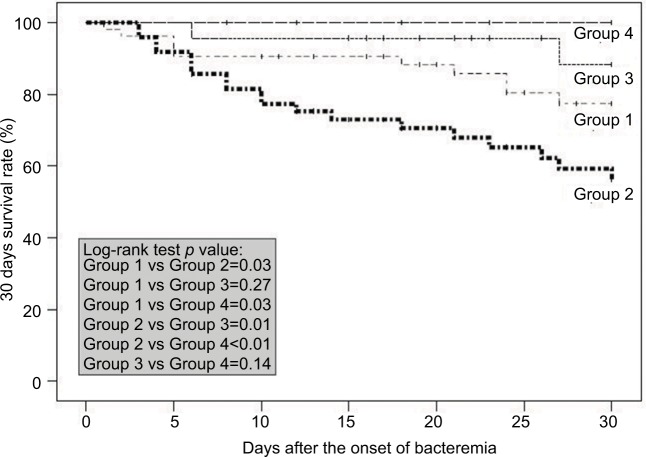
Figure 4.
Kaplan–Meier survival curve for patients treated with teicoplanin for MRSA bacteremia.
Notes: Cases are grouped according to treatment with teicoplanin maintenance dose ST or HI group) and further stratified by teicoplanin MICs. A log-rank test was used to compare the 2 survival curves. The results are indicated as 2-tailed p-values, with p<0.05 being statistically significant. Group 1: ST, teicoplanin MICs <1.5 mg/L for MRSA isolates (n=53); Group 2: ST, teicoplanin MICs ≥1.5 mg/L for MRSA isolates (n=49); Group 3: HI, teicoplanin MICs <1.5 mg/L for MRSA isolates (n=23); and Group 4: HI, teicoplanin MICs ≥1.5 mg/L for MRSA isolates (n=21).
Abbreviations: HI, high-dose regimen group; MIC, minimum inhibitory concentration; MRSA, methicillin-resistant Staphylococcus aureus; ST, standard-dose regimen group.

