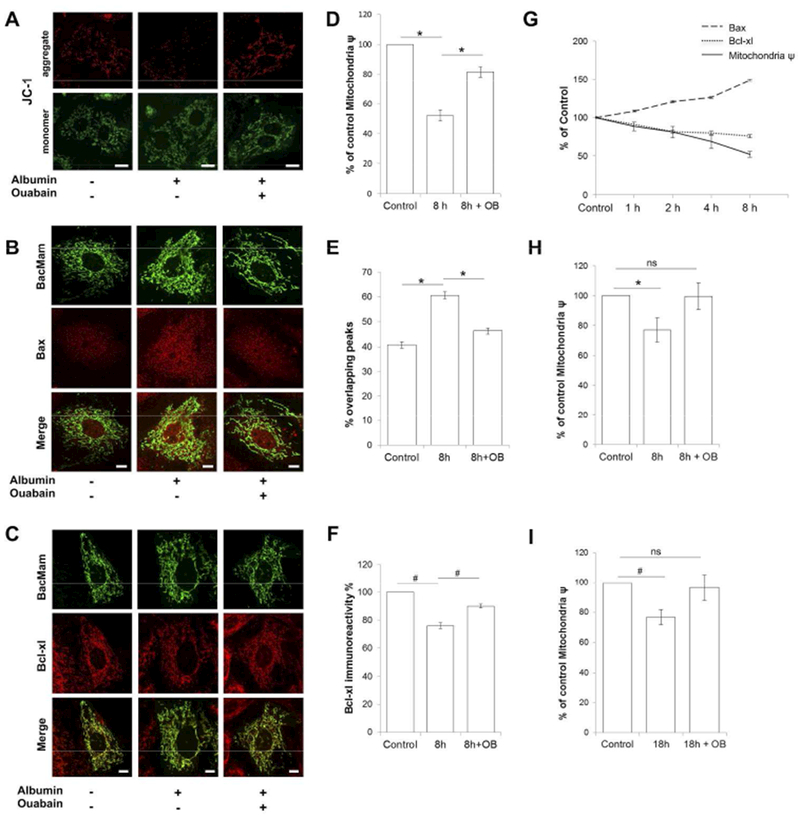
Figure 3. Ouabain protects from albumin triggered mitochondrial dysfunction.

A) Changes in mitochondrial membrane potential in RPTC incubated with vehicle, 2.5 mg/ml albumin or 2.5 mg/ml albumin and 5nM of ouabain for 8h, visualized using JC-1 dye. Aggregation of JC-1 indicate high-Δψ mitochondria in red fluorescence. Monomeric dye indicate low-Δψ mitochondria in green fluorescence. Mitochondrial depolarization is shown as a decrease in the red/green fluorescence intensity ratio. All scale bars = 10μm.
B) Localization of Bax to mitochondria in RPTC incubated with vehicle, 2.5 mg/ml albumin or 2.5 mg/ml albumin and 5nM of ouabain for 8h. Representative confocal images of Bax immunofluorescence staining shown in red and mitochondria in green, by using the mitochondrial marker BacMam 2.0. All scale bars = 5μm.
C) Bcl-xL expression in RPTC incubated with vehicle, 2.5 mg/ml albumin or 2.5 mg/ml albumin and 5nM of ouabain for 8h. Representative confocal images of Bcl-xL immunofluorescence signal in red and mitochondria in green, by using the mitochondrial marker BacMam 2.0. All scale bars = 5μm.
D) Quantification mitochondrial membrane potential change in RPTC incubated with vehicle (control) or 2.5 mg/ml albumin in the presence and absence of 5nM ouabain for 8h. *p<0.001. Data are shown as % of control, mean ± SEM. Experiments were repeated three times.
E) Quantification of Bax localization to mitochondria in RPTC incubated with vehicle (control) or 2.5 mg/ml albumin in the presence and absence of 5nM ouabain for 8h. Co-localization was assessed along two perpendicular line traces across the nucleus. Overlap of mitochondria and Bax fluorescence signal peaks along the lines were analyzed. Peaks were considered to overlap if spaced by no more than 140 nm. *p<0.001. Data are shown as % overlapping Bax/mitochondrial peaks, mean ± SEM. Experiments were repeated four times.
F) Quantification of Bcl-xL expression in RPTC incubated with vehicle (control) or 2.5 mg/ml albumin in the presence and absence of 5nM ouabain for 8h. #p<0.01. All data are shown as % Bcl-xL immune reactivity when control was set to 100%, mean ± SEM. Experiments were repeated four times.
G) Plot shows time dependent change as % of control for mitochondrial membrane potential (solid line), localization of Bax to mitochondria (dashed line) and Bcl-xL expression (dotted line) in response to 2.5mg/ml albumin.
H, I) Quantification of mitochondrial membrane potential change in RPTC incubated with vehicle (control) or 0.2 mg/ml albumin in presence and absence of 5nM of ouabain for 8 hours H) and 18 hours I). Data are shown as % of control, mean ± SEM #p<0.05. Experiments were repeated three times.
For all experiments Mann-Whitney U test was used to determine whether differences were statistically significant.
