
Figure 4. Long-term treatment with ouabain attenuates apoptosis of renal cortical cells in the PHN rat.
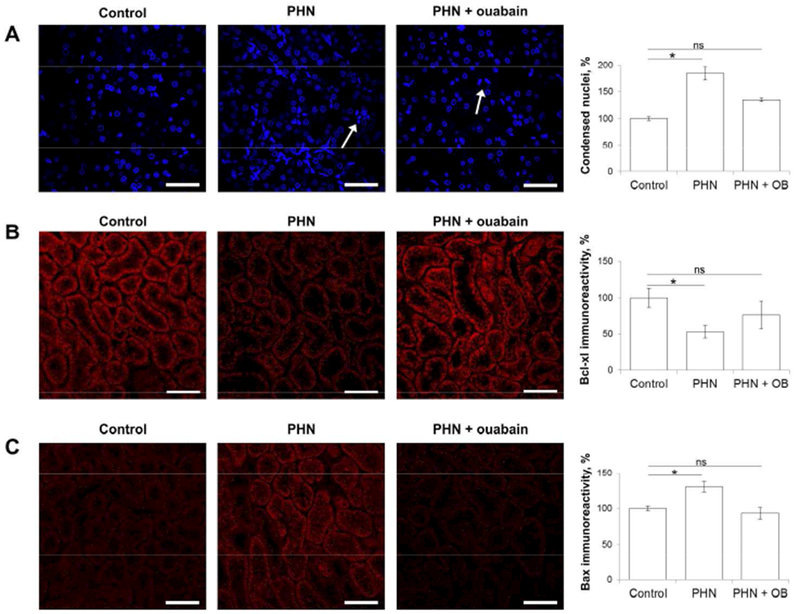
A) Representative DAPI staining of nuclei in renal cortex of control rats, PHN rats and ouabain-treated PHN rats at four months after PHN induction. The arrows indicate typical condensed nuclei. For quantification control was set to 100%. All scale bars = 40μm.
B) Representative immunostaining for Bcl-xL in renal cortex of control rats, PHN rats and ouabain-treated PHN rats at four months after PHN induction. For semi-quantitative evaluation of Bcl-xL immunoreactivity signal, control was set to 100%. All scale bars = 40μm.
C) Representative immunostaining for Bax in renal cortex of control rats, PHN rats and ouabain-treated PHN rats at four months after PHN induction. For semi-quantitative evaluation of Bax immunoreactivity signal, control was set to 100%. All scale bars = 40μm.
For all experiments, analysis was done in two sections from each kidney and in five (condensed nuclei) or six (Bcl-xl and Bax) randomly selected areas of the outer cortex. Histograms show the mean ± SEM. Statistical analysis was performed using ANOVA followed by t-test. *p<0.05