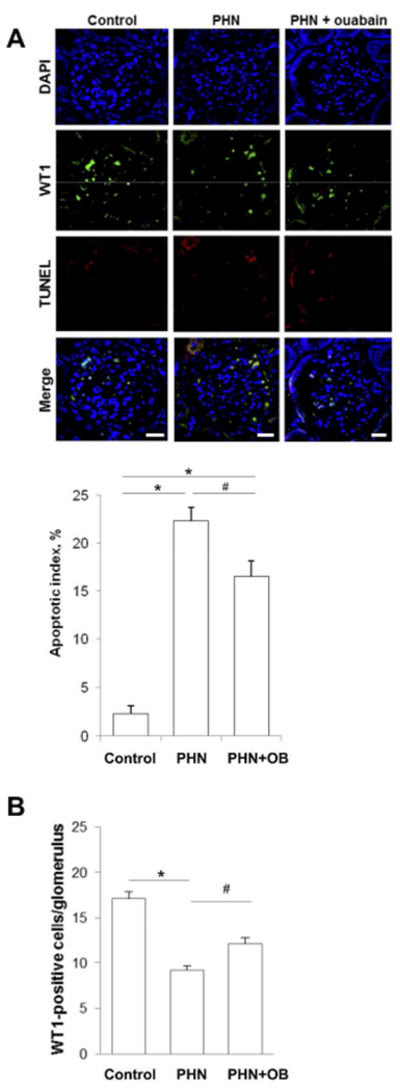
Figure 6. Kidneys from ouabain-treated PHN rats have more preserved WT1 positive glomerular cells than kidneys from vehicle-treated PHN rats.

A) Representative micrographs showing TUNEL stain in WT1 positive glomerular cells from control rats, vehicle-treated and ouabain-treated PHN rats. Sections were TUNEL-stained (red) to detect apoptotic cells and stained for WT1 (green) to detect podocytes, DAPI stained nuclei are shown in blue. All scale bars = 20μm. Histogram shows quantification of apoptotic podocytes, for control rats, PHN rats and ouabain-treated PHN rats. Histograms show mean ± SEM.
B) Histogram shows quantification of WT1 positive cells per glomerulus for control rats, PHN rats and ouabain-treated PHN rats. Histograms show mean ± SEM.
For all experiments Mann-Whitney U test was used to determine significant differences *p<0.01, #p<0.05
