
Figure 3. Orientation discrimination performance before and after an Ipc lesion.
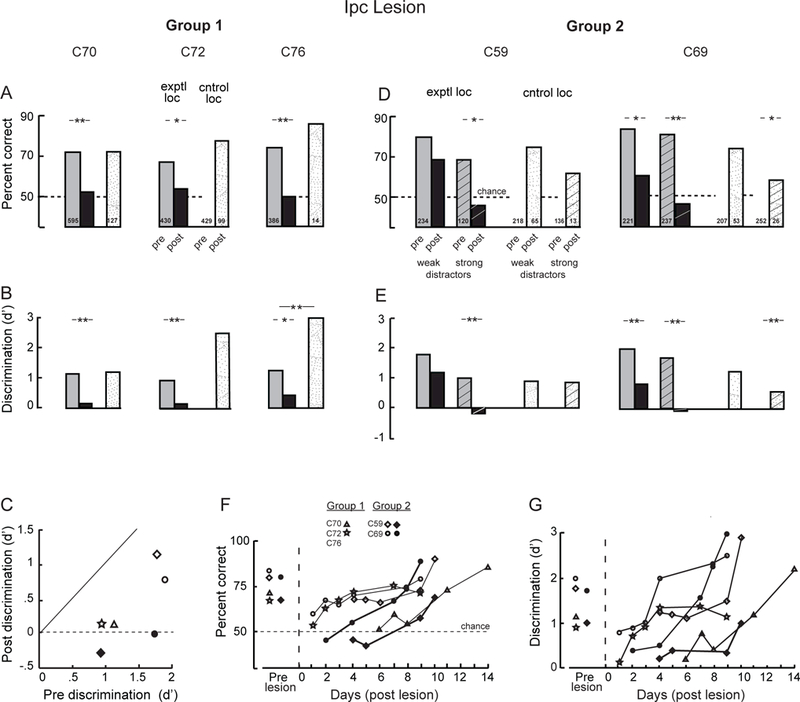
(A,B) Data for group 1 birds. Performance measured at baseline (before the Ipc lesion; gray and white bars), at the Ipc-lesioned location (exptl loc; black bar), and at a non-lesioned location (cntrol loc; stippled bar). C70 and C76 were tested with the single-location protocol, and C72 with the mirror-locations protocol (Methods). The post-lesion data for the lesioned and non-lesioned locations were collected on the same day. The post-lesion data for C72 and C76 were collected on day 1, and for C70 on day 6, following the lesion. Number inside each bar: sample size. Single asterisk: p<0.05, double asterisk: p<0.01, randomization test comparing pre-lesion with post lesion responses. (A) Percent correct performance. (B) Discrimination accuracy, d’ (Methods). (C) Comparison of d’ measured before (pre) and immediately after (post) Ipc lesions for all birds (symbol key). (D,E) Data for group 2 birds. The birds were tested with the distractors protocol (Methods). Gray and black bars: lesioned location (exptl loc); white and stippled bars: non-lesioned location (cntrol loc). Bars without hatching: performance with weak distractors; bars with hatching: performance with strong distractors (defined in Figure S1). Post lesion data were collected from C59 on day 4 and from C69 on day 1 for weak distractors and day 2 for strong distractors. (F,G) Recovery of orientation discrimination following the Ipc lesion for all birds. (F) Percent correct performance. (G) Discrimination accuracy (d’). The data represent responses to target gratings presented at the lesioned location plotted as a function of days following the Ipc lesion in each bird. The data from each bird are plotted with a distinct symbol (symbol key) and connected by a line. Open symbols: tested with weak or no distractors; filled symbols: strong distractors. See also Figure S2.