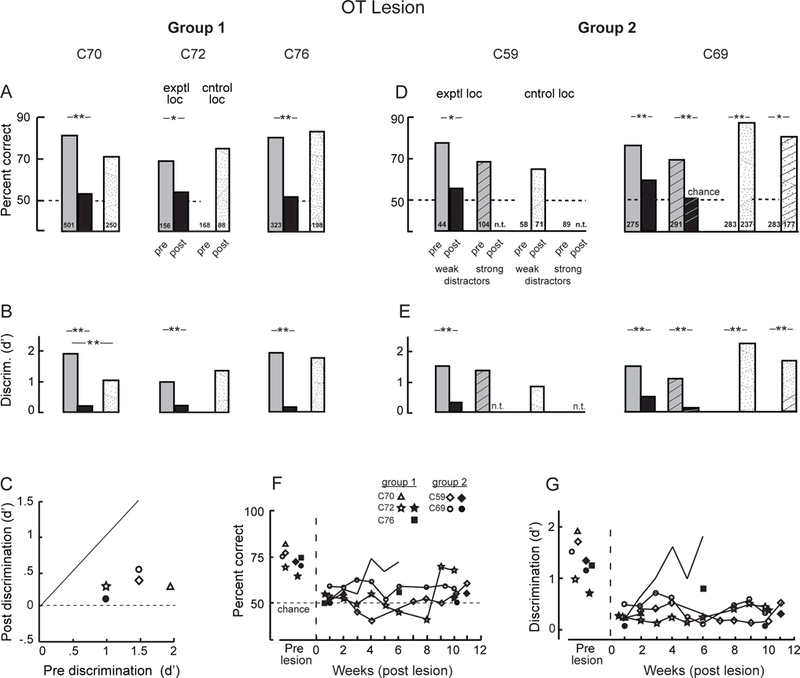
Figure 6. Orientation discrimination performance before and after an OT lesion.

(A-C) Data for group 1 birds are presented as described in the Figure 3 caption. The data represent performance only on trials with weak or no distractors. C70 and C76 were tested with the single-location protocol, and C72 was tested with the distractors protocol (Methods). (D,E) Data for the group 2 birds measured during week 1 (C69) or week 2 (C59) following the OT lesion are presented as described in the Figure 3 caption. The birds were tested with the cued-location protocol (Methods), but the data were combined across cueing conditions. n.t.: not tested. (F,G) Time-course of orientation discrimination performance following the OT lesion. The data were combined across days of testing according to the week post-lesion when they were collected. (F) Percent correct performance. (G) Discrimination accuracy (d’). The data represent responses to target gratings presented at the lesioned location plotted as a function of weeks (data combined across days of testing) following the OT lesion for each bird. The data from each bird are plotted with a distinct symbol (symbol key) and are connected by a line. Open symbols: tested with weak or no distractors; filled symbols: tested with strong distractors. See also Figures S1 and S3.
