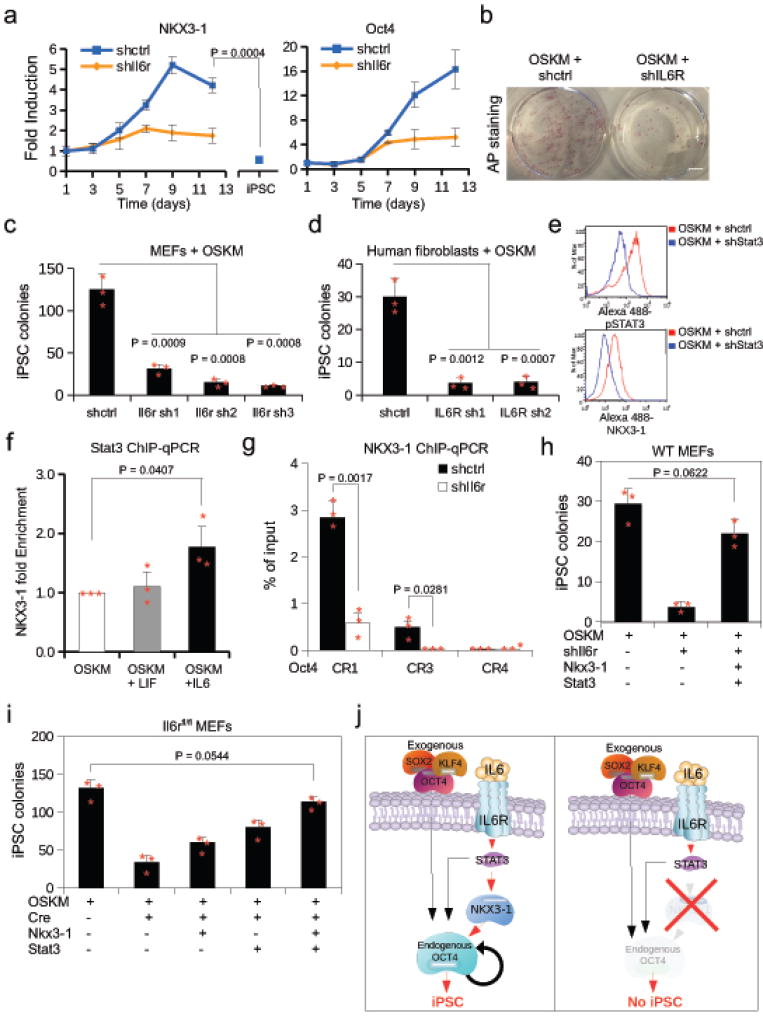
Figure 5. NKX3-1 functions downstream of the IL6-STAT3 cascade during iPSC induction.
(a) Expression time course in MEFs transduced with OSKM of Nkx3-1 and Oct4 expression after shIl6r or shctrl by qRT-PCR relative to day 1. Values were normalized to Gapdh. (n= 3 biological replicates). Unpaired Student’s t-test was used and data represents mean ± s.d. (b) Cultures of MEFs stained for alkaline phosphatase 10 days after transduction with shctrl or shIl6r plus OSKM. (3 biological replicates). (c and d) NANOG+ iPSC colony count from reprogrammed mouse embryonic fibroblasts (MEFs) or human BJ fibroblasts transduced with shRNAs targeting Il6r/IL6R or a control shRNA (n = 3 biological replicates). Unpaired Student’s t-test was used and data represents mean ± s.d. (e) Protein expression of p-STAT3 and NKX3-1 in MEFs transduced with OSKM and shRNA to Stat3 (shStat3) or a scramble control (shctrl) by intracellular flow cytometry. (n= 2 biological replicates with similar results). (f) STAT3 ChIP-qPCR at the Nkx3-1 promoter in MEFs treated with IL6 or LIF (n = 3 biological replicates). Unpaired Student’s t-test was used and data represents mean ± s.d. (g) ChIP-qPCR of NKX3-1 at the Oct4 promoter conserved regions CR1, CR3, and CR4 in which Il6r was knocked-down at day 8 post OSKM infection (n = 3 biological replicates). Unpaired Student’s t-test was used and data represents mean ± s.d. (h) MEFs transduced with various combinations of plasmids as indicated by + symbol. Colonies were counted 10 days post OSKM transduction (n = 3 biological replicates). Unpaired Student’s t-test was used and data represents mean ± s.d. (i) Il6rfl/fl MEFs were transduced with various plasmids as indicated by + symbol. Colonies were counted 10 days post OSKM transduction. (n = 3 biological replicates). Unpaired Student’s t-test was used and data represents mean ± s.d. (j) Schematic of function of NKX3-1 in the IL6-STAT3 signaling pathway during reprogramming to iPSC. Statistical source data and exact P values for a, c–d, and f–i can be found in Supplementary Table 5.

