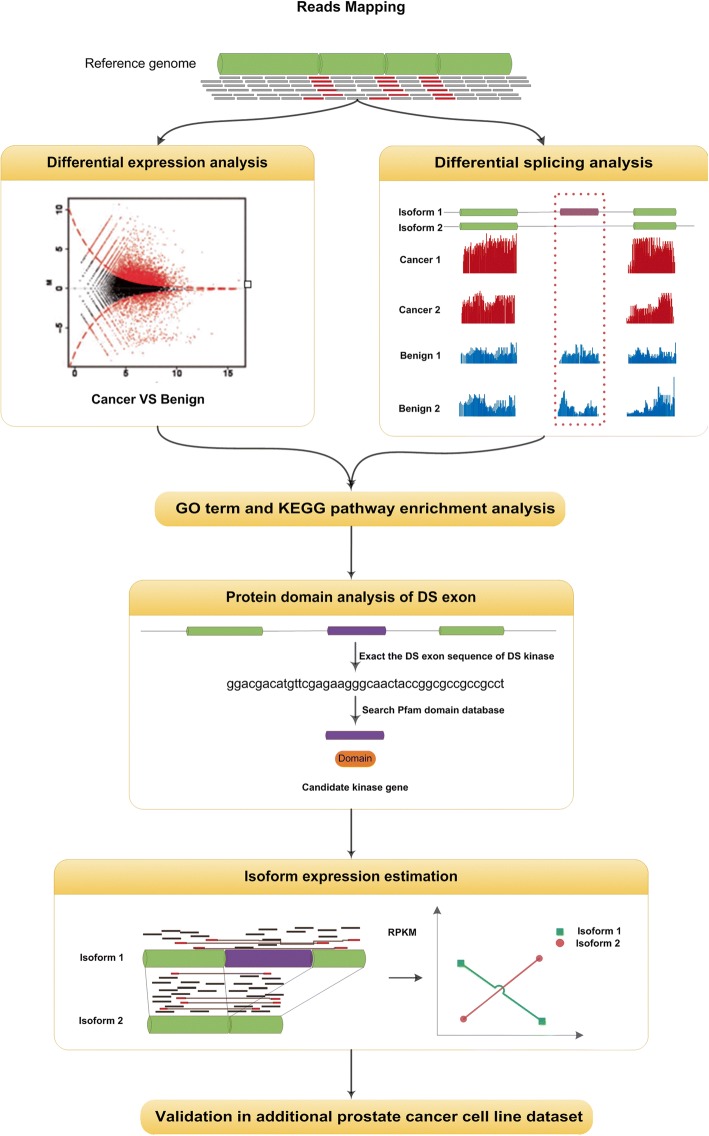
Fig. 1.
Overview of data analysis pipeline. After mapping the RNA-seq reads to the reference genome, differential expression (DE) analysis and differential splicing (DS) analysis were applied on the estimated gene and exon expression values, using DEGseq [15] and DSGseq [16] plus DEXseq [17], respectively. Enrichment analysis on GO terms and KEGG pathways were applied on the obtained lists of DE genes and DS genes to get the overall picture of functions of the DE and DS genes. Protein domain analysis was applied on the DS exons of the kinase genes. Isoform expressions were estimated using NURD [20] to quantitatively study the isoform proportions of candidate genes. An additional dataset was used to validate the observations

