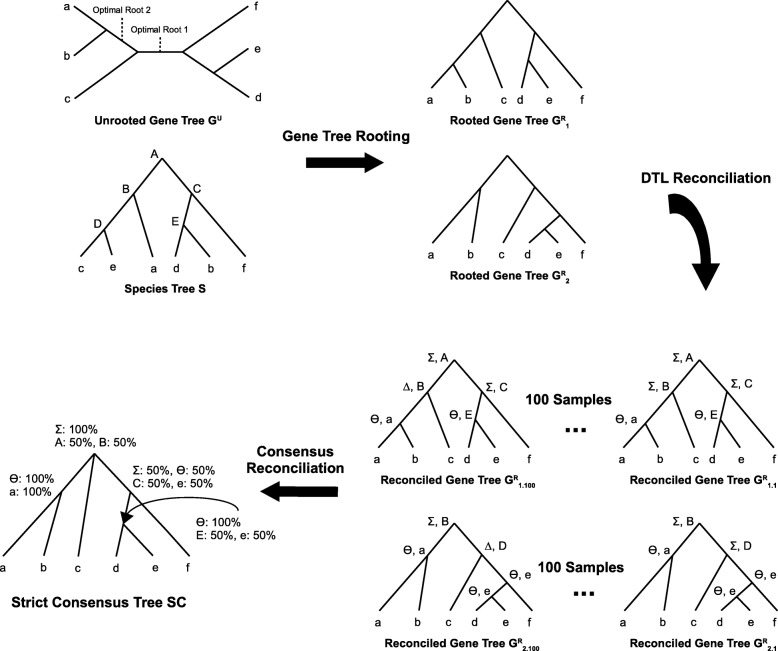
Fig. 1.
Consensus reconciliations. This figure illustrates the concept of a consensus reconciliation and shows how consensus reconciliations are computed. Given an unrooted gene tree and a species tree, the first step is to compute all optimal rootings (those that minimize the DTL reconciliation cost) of the unrooted gene tree. The second step is to reconcile each of the optimally rooted gene trees with the species tree multiple times to sample the space of all most parsimonious reconciliations uniformly at random; this sampling is required to account for any variation in different most parsimonious reconciliations for the same optimally rooted gene tree. In the figure, Σ,Δ, and Θ denote speciation, duplication, and transfer events, respectively. Each internal node in the reconciled tree is labeled with both its event type and the species tree node to which it maps. The final step is to aggregate each of the computed reconciliations into a single consensus reconciliation that shows the reconciliation of all those portions of the gene tree that are conserved across all optimal rootings. Thus, the tree underlying the consensus reconciliation is the strict consensus tree of all optimal rootings. Each internal node of this strict consensus tree is labeled with aggregated reconciliation information for that node from all sampled reconciliations across all optimal rootings

