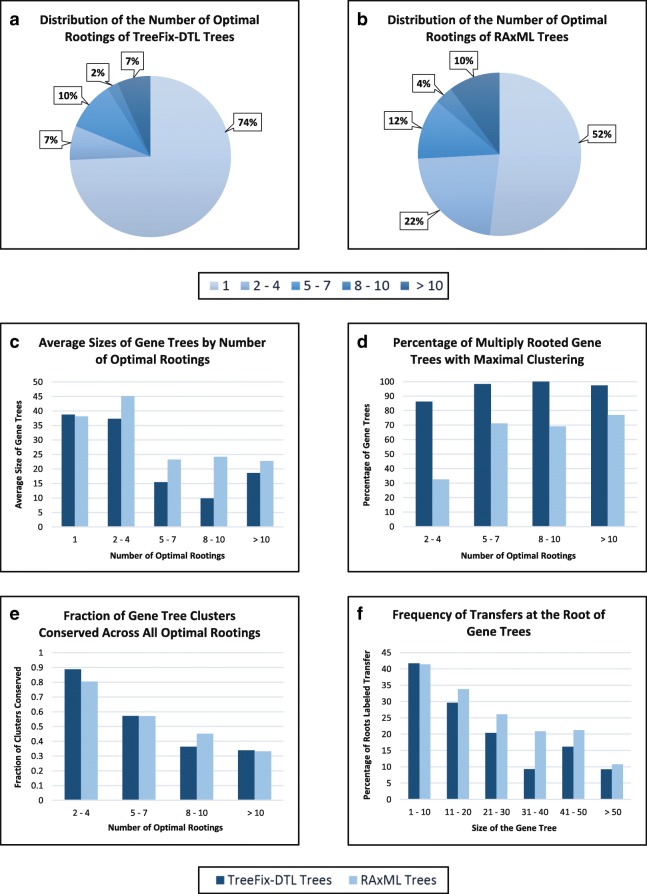
Fig. 3.
Experimental results. a and b Fraction of gene trees in the data set with the specified number of optimal rootings, for the TreeFix-DTL and RAxML gene trees, respectively. c Average gene tree size, in terms of number of leaves, for the TreeFix-DTL and RAxML trees, for gene trees with different numbers of optimal rootings. d Percentage of multiply rooted gene trees that have maximally clustered rootings for different numbers of optimal rootings. e Fraction of gene tree clusters conserved across all optimal rootings, for different numbers of optimal rootings. f Relationship between gene tree size and frequency of transfer events at their roots. Results shown are based on DTL reconciliation with loss, duplication, and transfer costs of 1, 2, and 3, respectively, and with an undated species tree. Gene tree sizes are shown in terms of number of leaves

