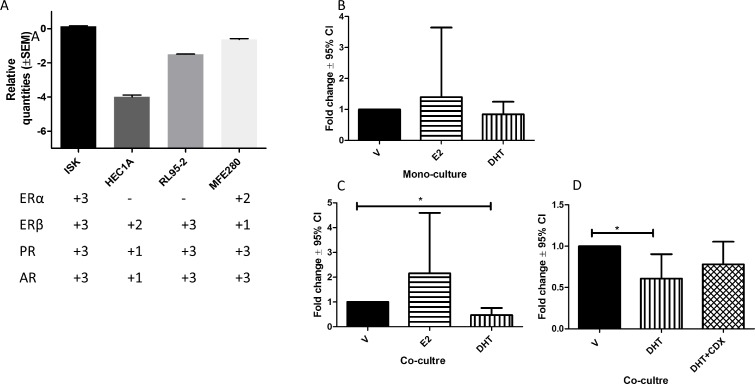
Figure 6. The expression of AGR2 mRNA level using RT-qPCR.
(A) The bar graph represents the relative mRNA levels for AGR2 in four different endometrial cancer cell lines and the plus score underneath represents the expression of steroid receptors mRNA for the corresponding cell line; (B) AGR2 mRNA in Ishikawa cell after 24 h treatment with 1 × 10⁻⁸ M estradiol (E2) or 1 × 10⁻⁶ M dihydrotestosterone (DHT); (C) in Ishikawa cells co-cultured with hESC treated with E2 and DHT; D) in Ishikawa cells co-cultured with hESC 24 h treatment with DHT with and without casodex (CDX) pre-blocking. N = 6 for each experiment.

