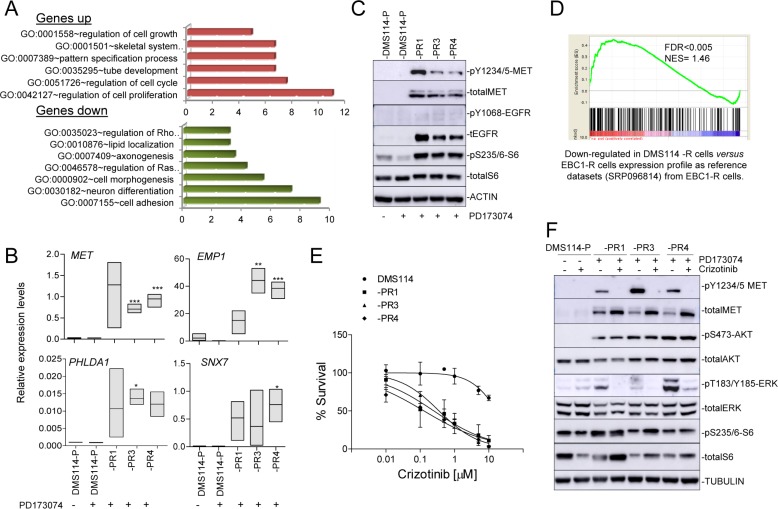
Figure 2. DMS114-R cells show specific gene expression profiles and MET activation.
(A) Enriched gene ontology (GO) classifications (P < 0.05 for all categories shown) among genes upregulated and downregulated in the gene expression profile of DMS114-R cells relative to DSM114-P cells (from Supplementary Table 2). (B) mRNA levels of indicated genes, relative to ACTB, in the indicated DMS114 cells. Error bars, SD of three replicates. *P < 0.05; **P < 0.005; ***P < 0.001. (C) Western blot of the indicated proteins in the DMS114 cells. In the case of DMS114-P, extracts with (+) and without (−) treatment with the PD173074 inhibitor (1 µM) are shown. ACTIN, total protein loading controls. (D) Graph of the ranked gene lists derived from comparison (using GSEA) of the indicated datasets and gene lists. Probabilities and false-discovery rates (FDRs) are indicated. (E) Cell viability of the DMS114 parental (DMS114-P) and DMS114 resistant (DMS114-R) cells, measured using MTT assays, after treatment with increasing concentrations of crizotinib. Lines represent cell survival relative to untreated controls of the MTT assays in the cells treated with increasing concentrations of the inhibitor for 72 h. Error bars indicate the standard deviation. (F) Western blot of the indicated proteins in the DMS114 cells. TUBULIN, total protein loading controls. In the case of DMS114-P, extracts with (+) and without (−) treatment with PD173074 (1 μM) or crizotinib inhibitors (100 nM) are shown.

