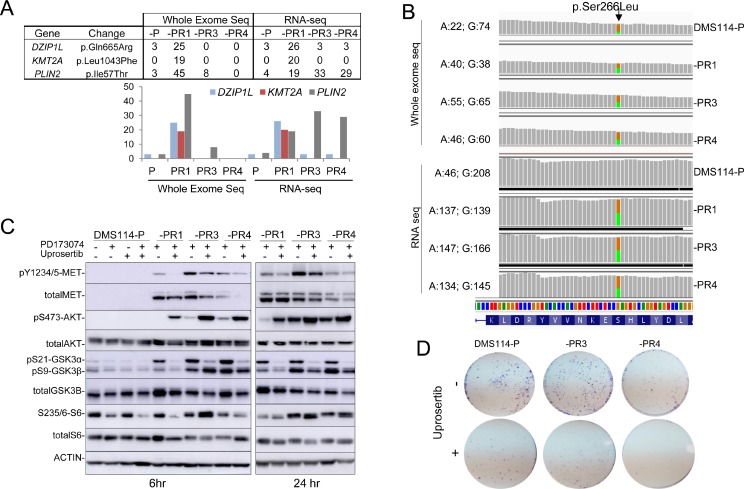
Figure 3. Genomic screening of DMS114-P and DMS114-R cells.
(A) Table (upper panel) and bar graph (lower panel) showing the percentage of mutated reads, at each indicated gene, for each variant, relative to the total number of reads found at the whole exome and mRNA sequencing (RNA-seq) analysis in the indicated cells. (B) The G > A mutation at AKT1 (encoding a S266L alteration) detected by whole-exome and RNA sequencing of the DMS114-P and DMS114-R cells. Green and orange indicate the A and G bases, respectively. The number of reads for each base in each cell is indicated, on the right. (C) Western blots of the indicated proteins in the DMS114-P and DMS114-R cells treated with (+) and without (−) the AKT inhibitor, uprosertib (200 nM) for 6 h (left panel) or 24 h (right panel). In the case of DMS114-P, extracts with (+) and without (−) treatment with PD173074 (1 µM) are also shown. (D) Representative example of the colony formation assay for DMS114-P and DMS114-R cells after treatment with the AKT inhibitor, uprosertib (500 nM).

