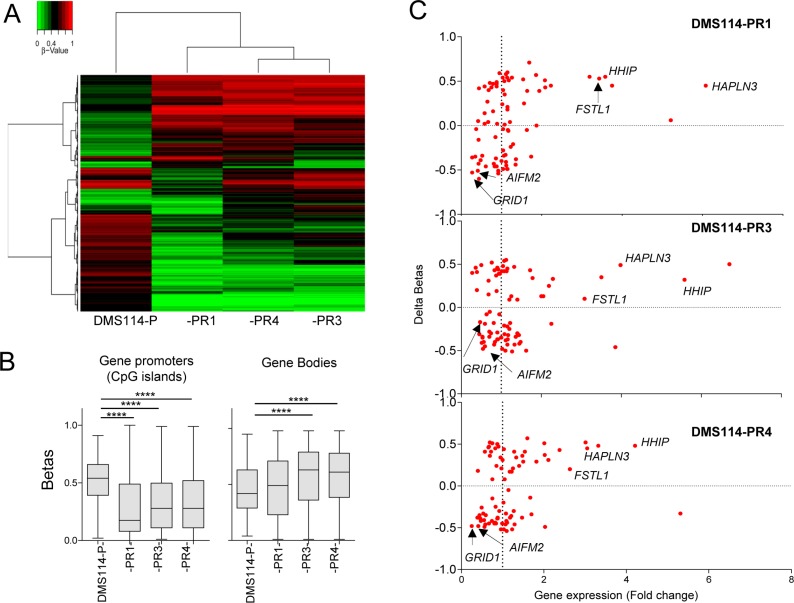
Figure 4. Genome-wide methylation analysis.
(A) Unsupervised hierarchical clustering in the indicated parental DMS114 cells (DMS114-P) and DMS114-R cells for the 5,000 most variable CpGs (from Supplementary Table 7). The heatmap colors illustrate beta values representing the degree of methylation, from low (green) to high (red), as shown by the scale at the top-left of the Figure. (B) Box-plots showing the beta values of the CpGs at the promoters (only CpG islands) or bodies of indicated cells, from Supplementary Table 7. Promoter regions were defined as the upstream 2000 bp and downstream 500 bp from the transcription start site (TSS) of each gene. Two-tailed unpaired Student’s t tests of the beta values of DMS114-P versus each group of DMS114-R cells. ****P < 0.0001. (C) Scatter-plot showing the mean change in promoter DNA methylation (delta betas) at the CpG islands (Y-axis) and the mRNA expression level of each gene, measured as RPKM (reads per kb per million reads) (X-axis). In general, the gene expression level was negatively correlated with DNA methylation level at the promoter regions.

