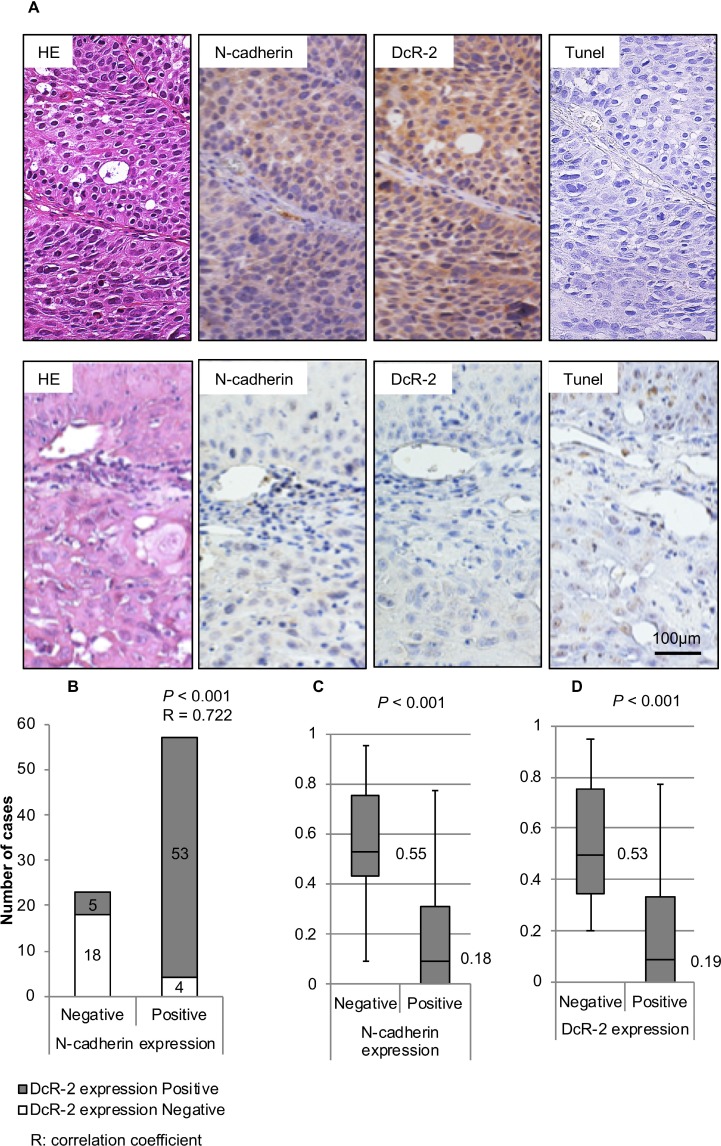
Figure 4. Expression of N-cadherin and DcR-2, and correlations to AI.
(A) The upper panel shows a representative case with HE-staining, positive N-cadherin expression, positive DcR-2 expression, and AI of 0 at a magnification of 200×. The lower panel shows a representative case with HE-staining, negative N-cadherin expression, negative DcR-2 expression, and AI of 0.65 at a magnification of 200×. (B) Correlation between N-cadherin and E-cadherin expressions was analyzed using the Spearman test. The graph shows the number of specimens with positive or negative expression of DcR-2 in each group of positive or negative expression of N-cadherin. (C) Correlations between N-cadherin expression and AIs were analyzed using the Mann–Whitney U test. Box-whisker plots show AI in relation to N-cadherin expression. Median values are shown as heavy lines within the box. (D) Correlations between DcR-2 expression and AIs were analyzed using the Mann–Whitney U test. Box-whisker plots showed AI in relation to DcR-2 expression. Median values are shown as heavy lines within the box.

