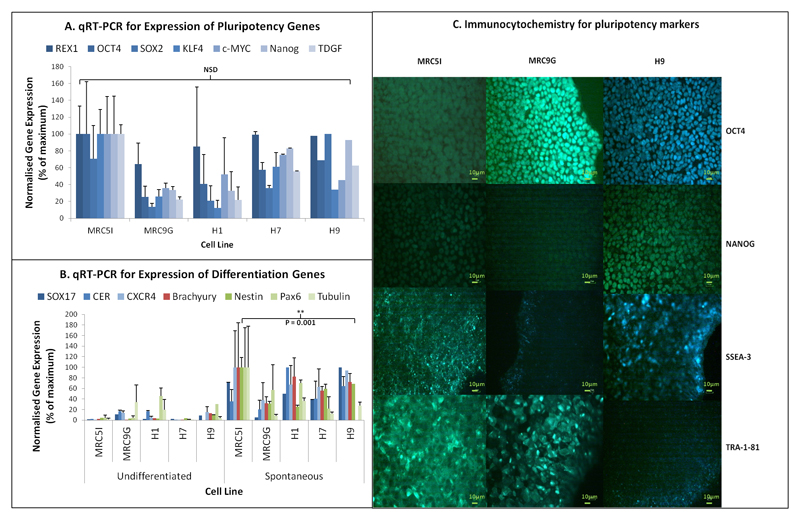
Figure 1.
Characterisation of new iPSC lines (MRC5I & MRC9G) in comparison with ESC lines (H1, H7 & H9). A) qRT-PCR analysis of pluripotency; B) qRT-PCR analysis of genes characteristic of each embryonic germ layer: endoderm (SOX17, CER & CXCR4), mesoderm (BRACHYURY), and ectoderm (NESTIN, PAX6 & TUBULIN); C) Immunocytochemistry for pluripotency markers OCT4, NANOG, SSEA-3 and TRA-181.
N = 3, ANOVA with Fisher’s a priori test used to determine statistical significance of differences between groups.

