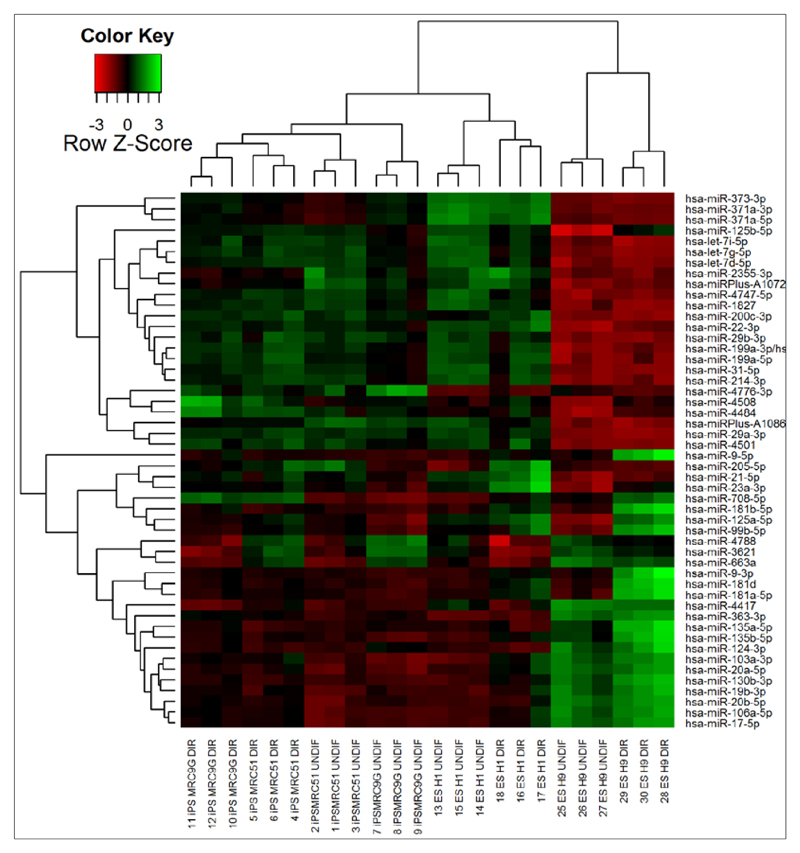
Figure 4.
Unsupervised hierarchical clustering analysis based on the normalised expression of the 50 miRNAs with the highest variation between samples (iPSC lines = MRC5I and MRC9G; ESC lines = H1 and H9; DIR = differentiated; UNDIF = undifferentiated). miRNAs which are expressed at lower levels than in the reference sample are shown in red, while miRNAs which are expressed at higher levels are shown in green. Z score transformation allows expression of hybridisation values for individual miRNAs as a unit of standard deviation from the normalized mean of zero.

