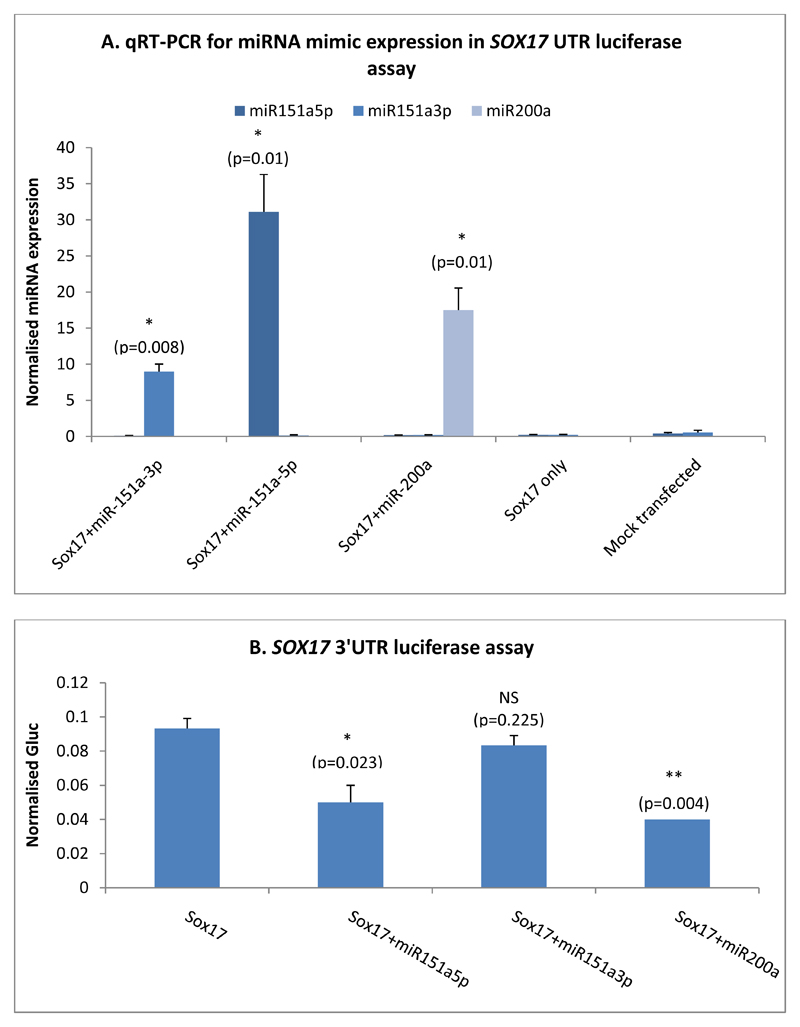
Figure 9.
A) qRT-PCR data showing expression of miR-151a-5p, miR-151a-3p and miR-200a in 293FT cells transfected with respective mimics. N=3, a paired two-tailed t-test was used to test for statistical significance between control and experimental sample. B) Normalised luciferase readings from 293FT cells transfected with the SOX17 3’UTR plasmid and a miR-151a-5p mimic. Data shown is one assay, representative of four independent experiments. N=3, a paired two-tailed t-test was used to test for statistical significance between controls and experimental sample.

