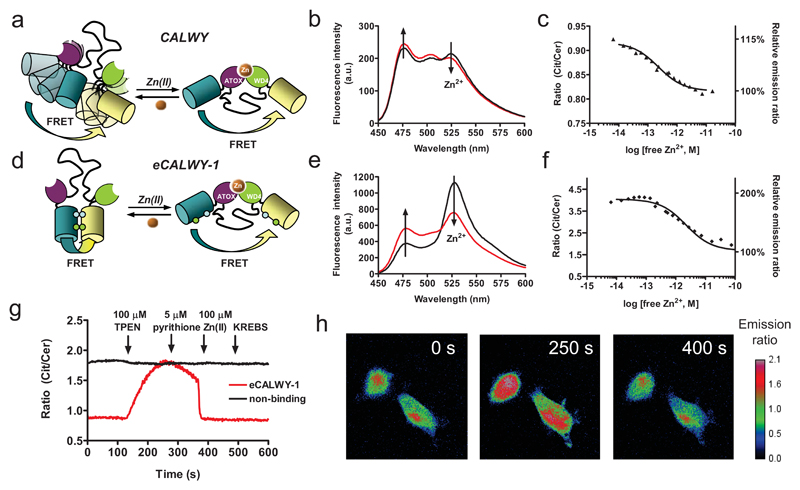
Figure 1. Design and properties of eCALWY-1, a genetically-encoded Zn2+ sensor based on conformational switching.
Schematic representation of the CALWY (a) and eCALWY-1 (b) sensors. Introduction of S208F and V224L mutations fluorescent domains results in large increase in the ratiometric response. Emission spectra of CALWY (c) and eCALWY-1 (d) before (black line) and after (red line) addition of 0.9 mM Zn2+ in 1 mM HEDTA (b) or EGTA (e). Zn2+ titrations of CALWY (c) and eCALWY-1 (f), showing the ratio of yellow and cyan emission (R527/475) as a function of Zn2+ concentration using 420 nm excitation. The solid lines depict fits assuming single binding events with Kd’s of 0.22 and 2 pM for CALWY and eCALWY-1, respectively. Measurements were performed using ~ 1 µM protein in 150 mM Hepes, 100 mM NaCl, 10% (v/v) glycerol, pH 7.1 at 20 ºC. (g) Response of single HEK293 cells expressing either eCALWY-1 or a non-binding variant (eCALWY-NB) to Zn2+ depletion and addition as measured by the ratio of Citrine and Cerulean emission. Cells were perfused with KB buffer (0 s), KB buffer containing 50 μM TPEN (120 s), 5 μM pyrithione (240 s), 5 μM pyrithione/100 μM Zn(II) (360 s) and KB buffer (480 s). (h) False-colored fluorescence ratio micrographs of HEK293 cells expressing eCALWY-1 after 0, 250, and 400 s of the experiment described in (g).

