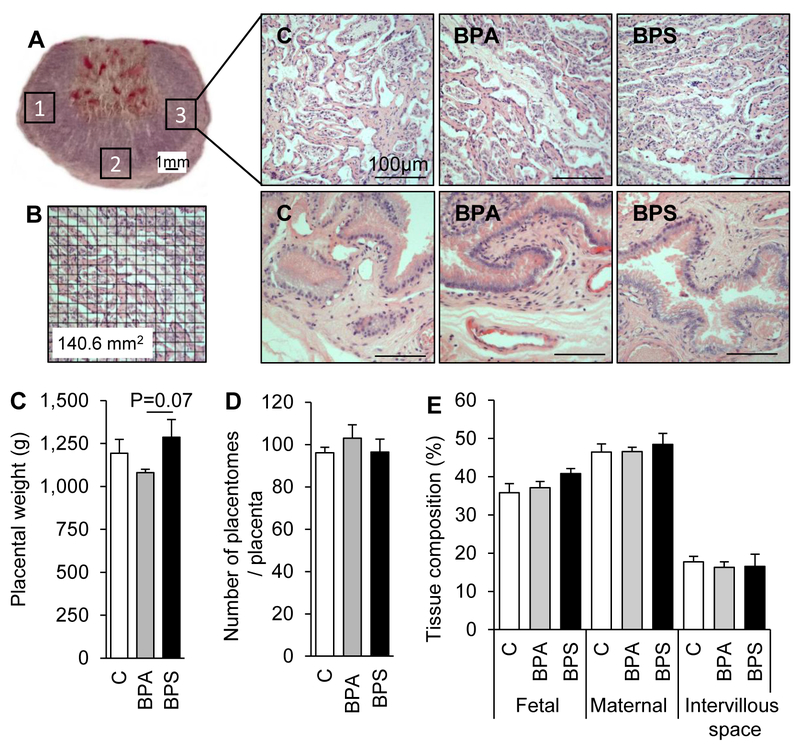
Figure 2.
(A) Placentome cross-section stained with hematoxylin and eosin. Numbered squares (1, 2, and 3) denote approximate areas where images were taken for analysis of placental stereology and immunohistochemistry of e-cadherin, GCM1, and lectin (Figures 3, 4, and 5). Representative images of placentome cross-sections (top) and intercotyledonary membranes (bottom) in control (left), BPA- (middle) and BPS- (right) exposed females at gestational day (GD) 120 (20 days after discontinuation of exposure). (B) Example of placentome image with grid overlay used for placental stereology (Figure 2E). (C) Mean (± SE) placental weight, in control (open bars), BPA- (gray bars) and BPS- (closed bars) exposed females. (D) Number of placentomes per placenta. All placentome types were included (see text for details). (E) Placental tissue distribution, depicting percent intervillous space and fetal and maternal tissue contributions in control (open bars), BPA (gray bars), and BPS (black bars) exposed placentas. N=6–7/group. Four to five images studied per placentome.

