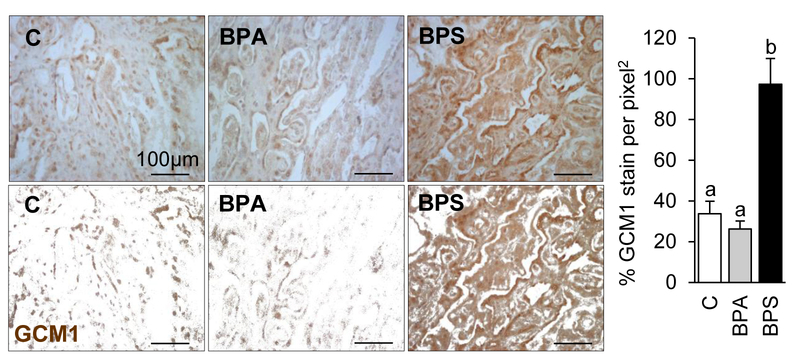
Figure 4.
Representative images of placentome cross-sections immunostained against GCM1 (top) and respective processed images for imaging analyses (bottom) in control (left), BPA- (middle) and BPS- (right) exposed females at gestational day (GD) 120 (20 days after discontinuation of exposure). GCM1 protein (mean ± SE) quantification in control (open bars), BPA- (gray bars) and BPS- (closed bars) exposed females by immunohistochemistry. N=6–7/group. Ten images studied per placentome. Different letters denote statistical differences among treatment groups at P<0.05.

