Fig. 4.

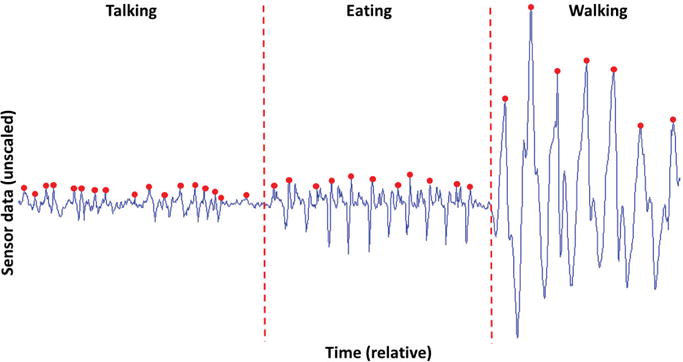
Example data from the y-axis of the behind-the-ear gyroscope. The dots indicate local maxima with high energy in the signal. As compared to talking, the peaks for eating are more periodic and ”spiky”.

Example data from the y-axis of the behind-the-ear gyroscope. The dots indicate local maxima with high energy in the signal. As compared to talking, the peaks for eating are more periodic and ”spiky”.