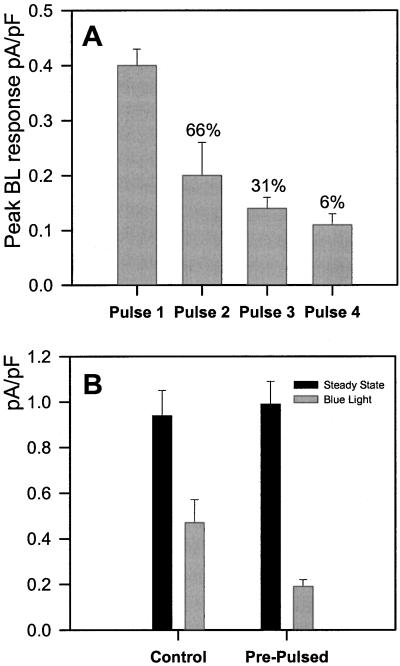
Figure 5.
A, BL responses desensitize. Mean (± se) BL-activated pump currents in response to a sequence of BL pulses are plotted against pulse number. Only responsive cells are included with each mean, and the percentage of cells responding to each pulse are indicated above each bar. Peak BL-stimulated pump responses become progressively smaller with each pulse. B, Prepulsing a cell before going whole cell and then applying a second pulse while recording pump current causes a level of desensitization to BL that is comparable with the desensitization observed in cells where both pulses were delivered during whole cell recording (see “pulse 2” in 4A). Only responsive cells are included with each mean.

