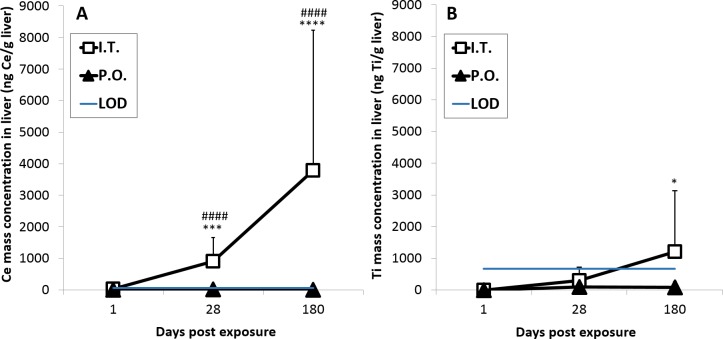
Fig 5.
Mass concentration of Ce (A) and Ti (B) in liver tissue. The concentrations were measured by ICP-MS following intratracheal instillation and oral gavage of CeO2 and TiO2 NPs, respectively. Data are presented as mean + SD. An asterisk (*) denotes P ≤ 0.05, (***) P ≤ 0.001, (****) P < 0.0001 of Ce or Ti mass concentration in exposed groups compared to vehicle controls. Hashtags (###) denote P < 0.001 and (####) P < 0.0001 of Ce mass concentration in intratracheally exposed group (IT) compared to orally exposed groups (PO). LOD–Limit of detection.

