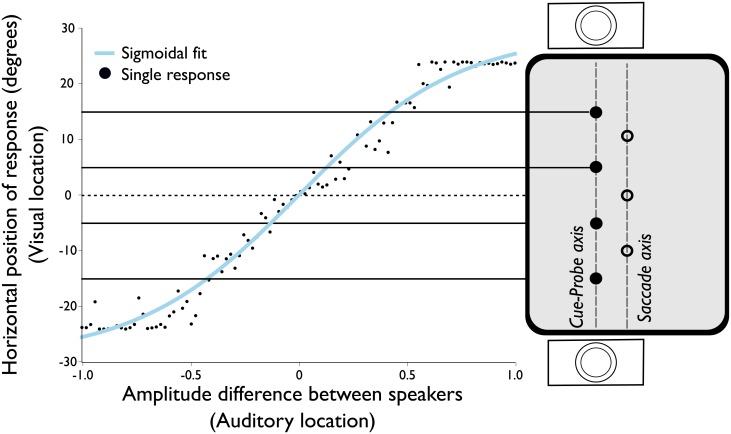
Fig 2. Sigmoid fit of pointing responses to auditory locations of a single participant in the matching task.
The black dots show the participant’s localization response to a panned white-noise stimulus. The blue line shows the sigmoid fit to the responses. The locations of the probes used in the auditory block are superimposed on the right side and are connected via a black line. Note that the illustration of the screen is rotated by 90 degrees here, with respect to Fig 1, to align the stimulus location with the vertical axis in the graph.

