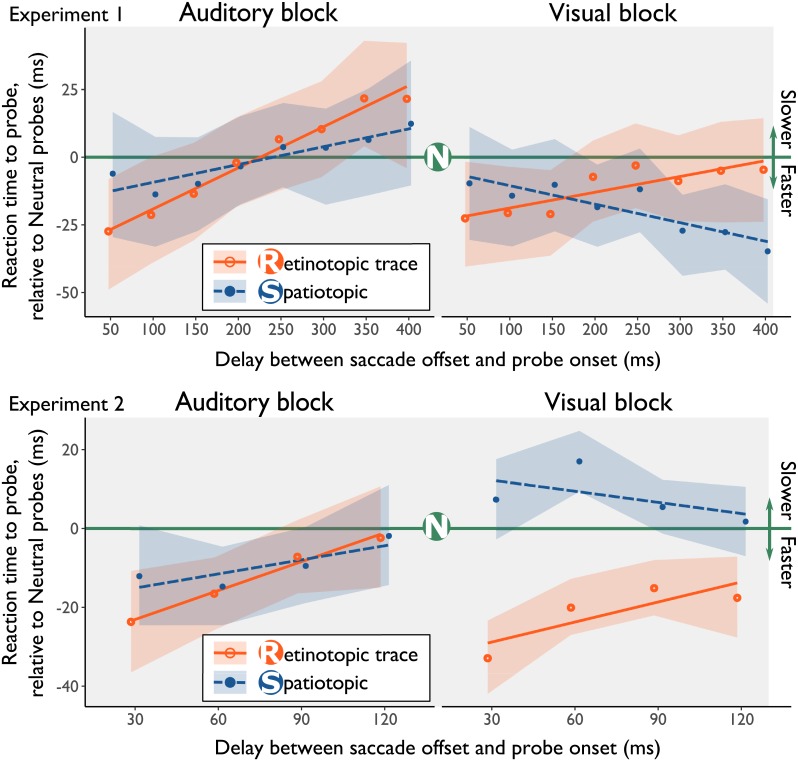
Fig 3. Results from the linear mixed effects models in Experiment 1 and Experiment 2.
The green line represents the fit of the linear mixed model of reaction times to probes shown at the neutral location, all other lines are drawn relative to the neutral condition. The lines represented the fits from the linear mixed models, the points indicate the binned average data, after correcting for online saccade detection. In both the visual and auditory experimental block, probes at the location of the retinotopic trace are reacted to significantly faster. This facilitation decreases with longer delays between saccade offset and probe onset, indicating that the retinotopic trace extinguishes over time. Shaded regions represent bootstrapped 95% CI’s. To reduce visual overlap, the orange and blue line have been offset slightly in the horizontal direction.

